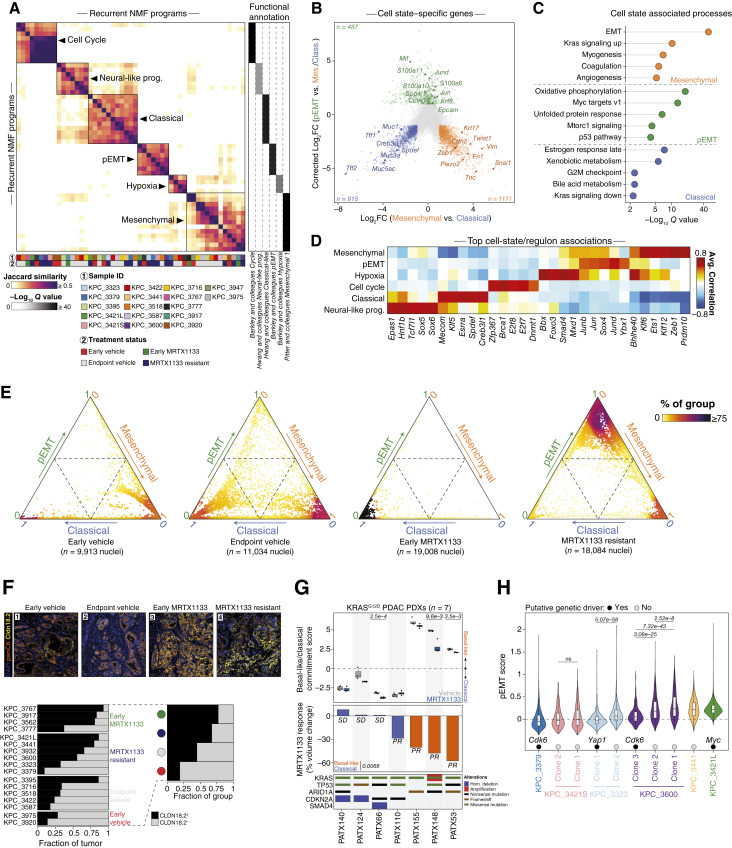
Figure 5.
Malignant cell state evolution along the epithelial–mesenchymal axis during response and resistance to MRTX1133 in vivo. A, Left, Heatmap of pairwise Jaccard similarities between recurrent NMF programs identified across KPC tumors and ordered by hierarchical clustering. Six consensus classifications (metaprograms) are labeled and indicated by squares. Right, Heatmap depicting the top functional annotation for each metaprogram. Significance determined by hypergeometric test and adjusted with Benjamini–Hochberg correction. B, Cell state–centered differential gene expression across the mesenchymal, classical, and pEMT malignant cell populations. Cell state-specific upregulated genes are colored, and subsets are labeled. C, Top enriched Hallmark gene expression signatures across cell state–specific upregulated genes displayed in B. Significance determined by hypergeometric test and adjusted with Benjamini–Hochberg correction. D, Heatmap depicting the top five regulons associated with each metaprogram. The average Pearson’s correlation coefficients are calculated between each regulon activity scores, as inferred by pySCENIC, and metaprogram scores across malignant nuclei. E, Ternary plot displaying the cell state classification probability of each nucleus across the classical-pEMT-mesenchymal tripartite framework, as calculated by a Markov absorption-based classifier (“Methods”). The coloration gradient is proportional to the fraction of nuclei from a given treatment group found in the same neighborhood. F, Top, Multiplex immunofluorescence (mIF) of PDAC areas from four representative tumors with overlaid DAPI (nucleus), pan-cytokeratin (panCK, tumor), and Claudin-18.2 immunostaining. The scale bar represents 50 μm. Bottom left, Tumor-wise Claudin-18.2 fluorescence classification across treatment groups via mIF. Bottom right, Treatment-wise classification of Claudin-18.2 expression via mIF. G, Improved responses observed in basal-like compared with classical human PDAC PDX models. Top, Boxplot depicting the basal-like/classical difference score for each PDX model following 3-day treatment with the indicated regimen. Significance for the vehicle vs. MRTX1133 comparison was determined by two-sided Student t test. The P value for the treatment comparison is displayed at the top of each PDX model’s track and only significant comparisons are displayed. Middle, Barplot depicting the tumor volume change at endpoint after MRTX1133 treatment, compared to baseline. Significance between basal-like and classical models determined by two-sided Student t test. Bottom, Co-mutation plot of recurrently mutated genes in PDAC for each PDX model. H, Violin plot depicting the pEMT scores from snRNA-seq across nuclei from MRTX1133-resistant tumors, divided according to subclones as determined by inferred copy number profiles. Genomic amplifications identified by WES and inferCNV are denoted. Scores are compared between subclones within the same tumors. Significance was determined between clones from the same tumor by a two-sided Wilcoxon rank-sum test and adjusted with Benjamini–Hochberg correction. The P values are displayed on top of each clone pairs.

