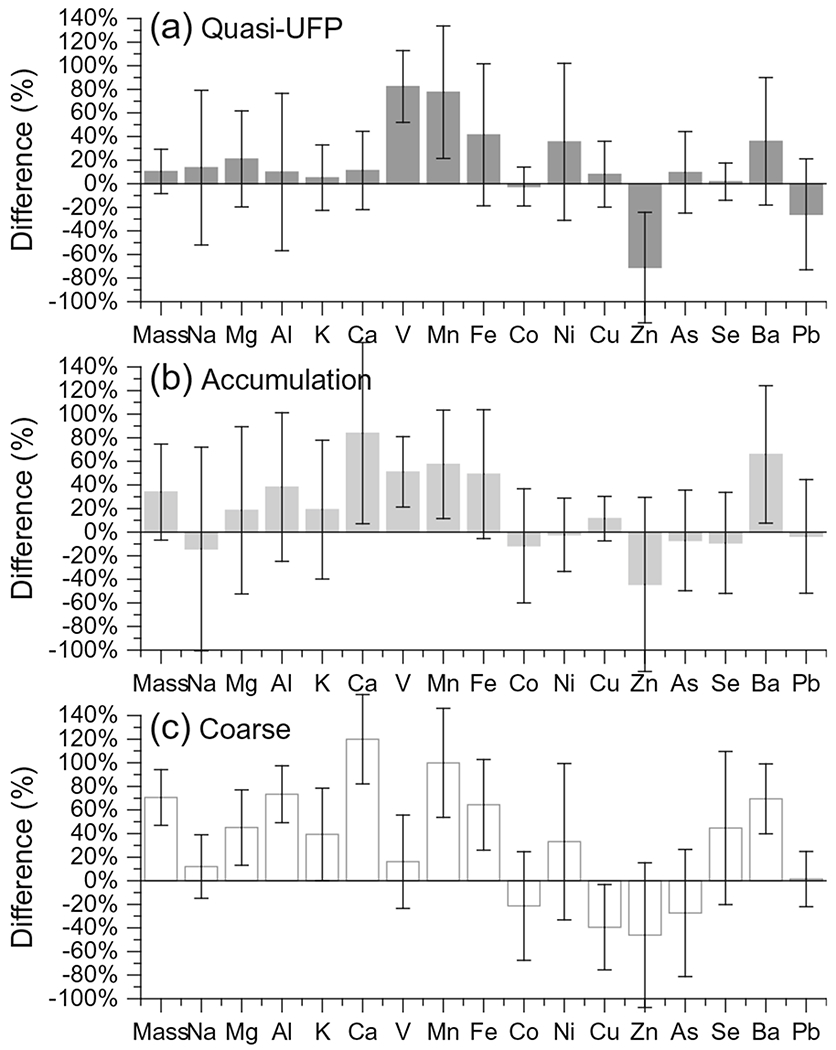
Fig. 2.

Mean differences of weekly paired elements between the low-SES community and the high-SES community in a quasi-UFP, b accumulation, and c coarse modes between June and November 2013. % Difference = [(low-SES conc. − high-SES conc.) / {(low-SES conc. + high-SES conc.) / 2}] × 100
