Fig. 3.

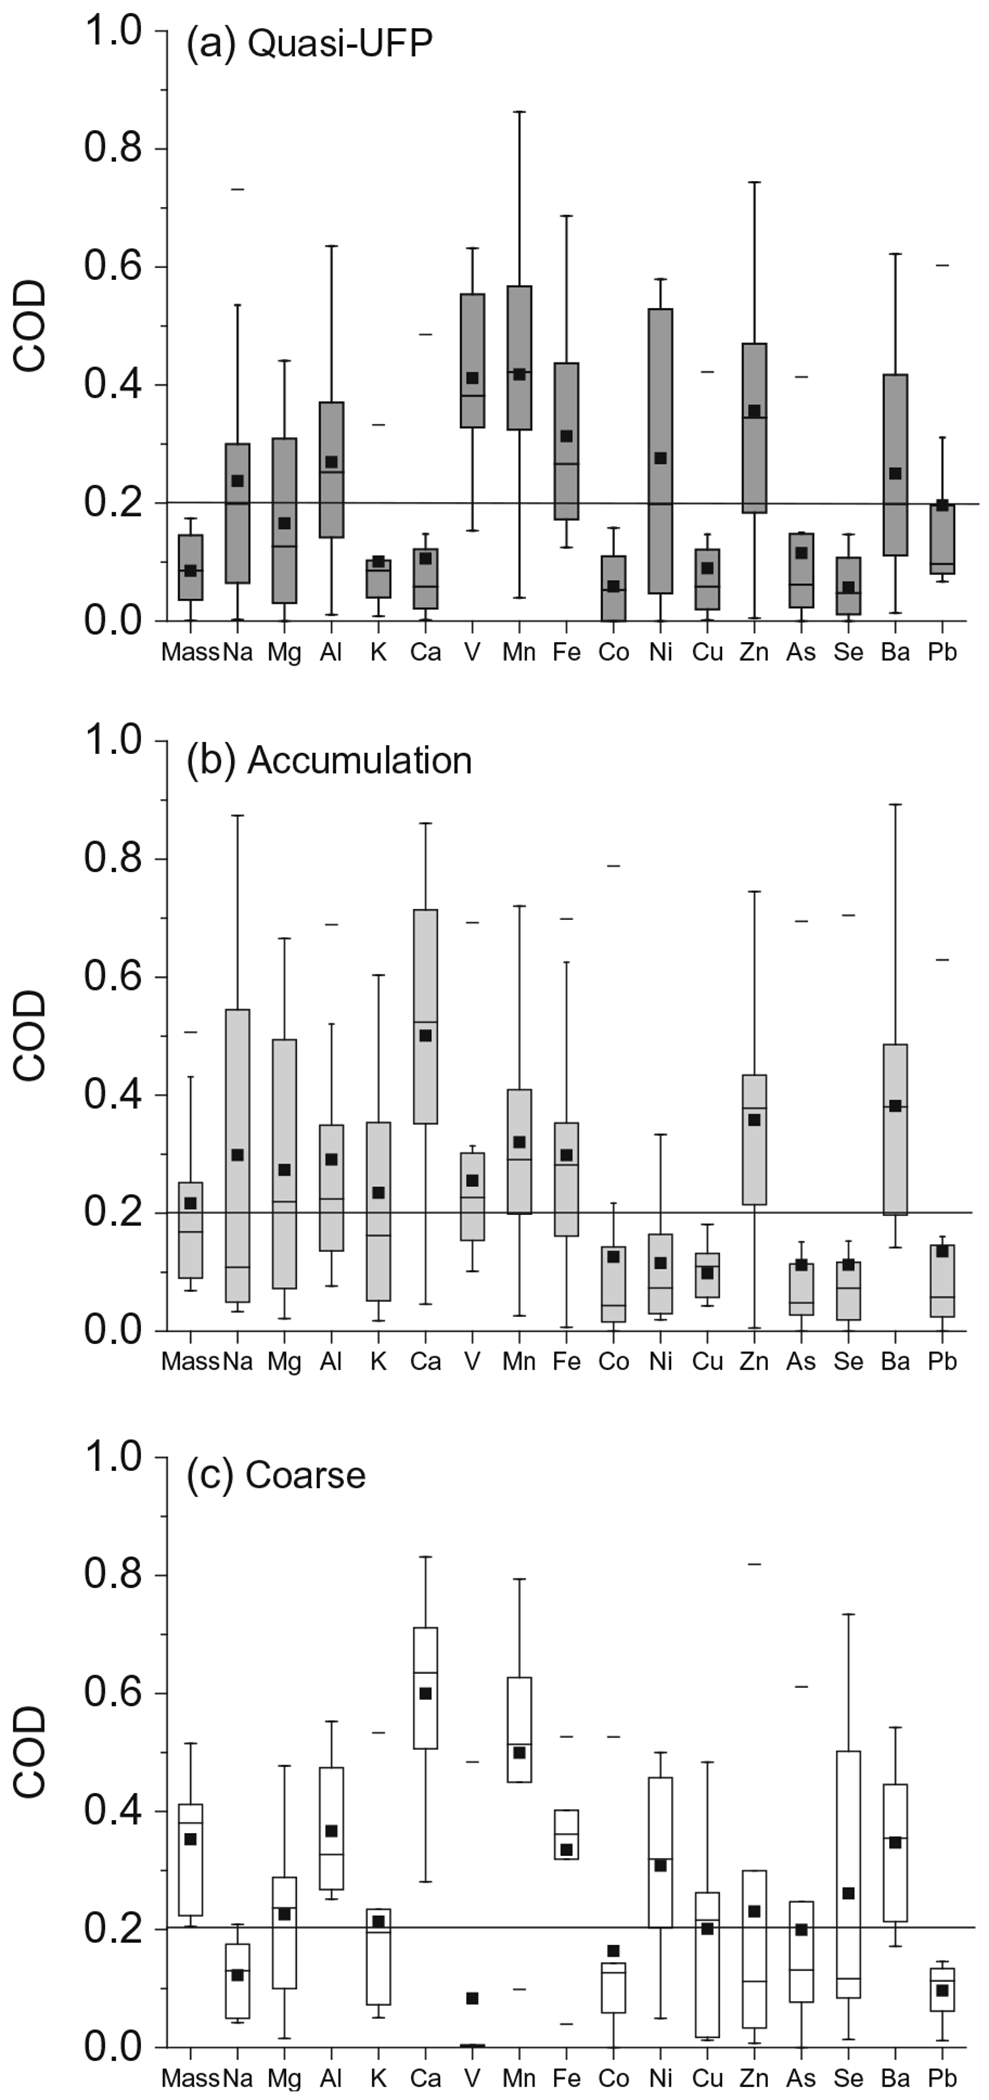
Box plots of coefficients of divergence (COD) of PM mass and elements for a quasi-UFP, b accumulation, and c coarse size modes. Plots show minimum, 25th percentile, median, mean (filled square), 75th percentile, and maximum

Box plots of coefficients of divergence (COD) of PM mass and elements for a quasi-UFP, b accumulation, and c coarse size modes. Plots show minimum, 25th percentile, median, mean (filled square), 75th percentile, and maximum