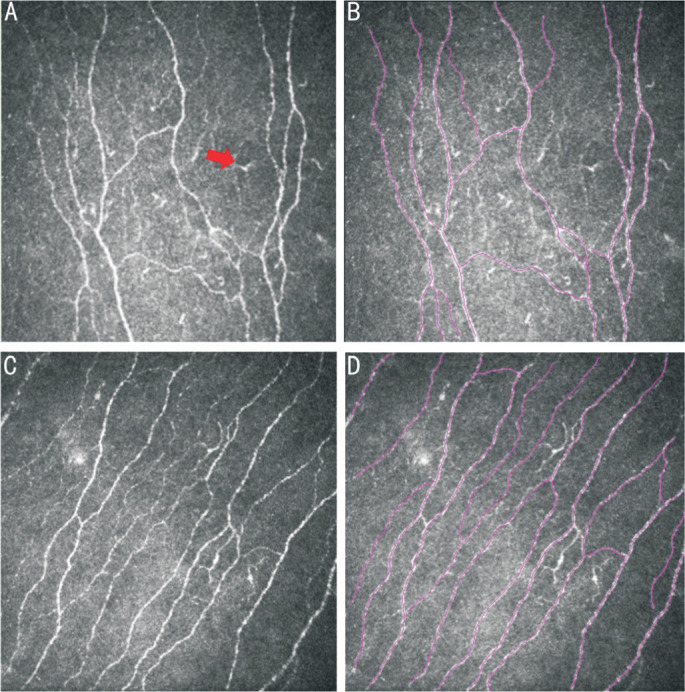
Figure 1. CNF images of patients in the DM group and the control group observed under CLCM and traced using Neuron J plugin of Image J software.

A: CNF images of patients in the DM group observed under CLCM showed lower CNF density, irregular and tortuous morphology, and abundant LC cells (the red arrow pointing to the increased and matured LCs under corneal epithelium in diabetes). B: Analysis and tracing of CNF in patients from the DM group observed under CLCM using Neuron J plugin. C: CNF images of patients in the control group observed under CLCM showed higher CNF density, straighter morphology, and fewer LC cells. D: Analysis and tracing of CNF in patients from the control group observed under CLCM using Neuron J plugin (Purple lines indicate the automatically recognized fiber morphology by Neuron). CNF: Corneal nerve fiber; DM: Diabetes mellitus; CLCM: Corneal laser confocal microscopy; LC: Langerhans cell.
