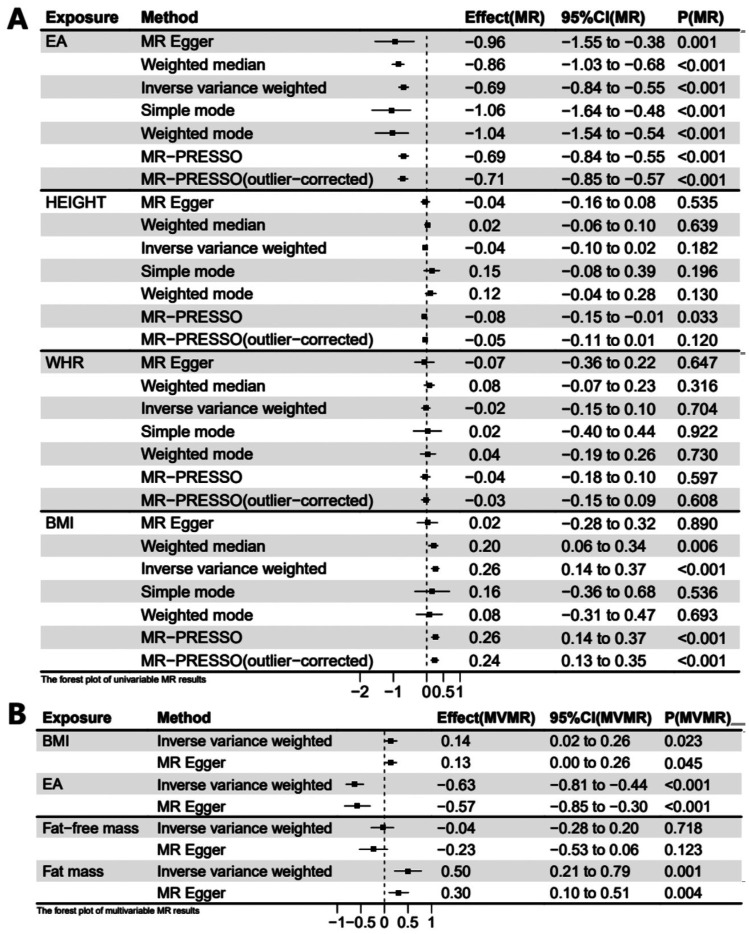
Figure 2. Forest plots of univariable and multivariable MR estimation of exposures on MSE.
A: Forest plot of 1 SD exposure increase resulting in MSE change in the UVMR model; B: Forest plot of 1 SD exposure increase resulting in MSE change in the MVMR model. UVMR: Univariable Mendelian randomization; MVMR: Multivariable Mendelian randomization; BMI: Body mass index; EA: Educational attainment; WHR: Waist-hip ratio; Fat-free mass: Whole body fat-free mass; Fat mass: Whole body fat mass.

