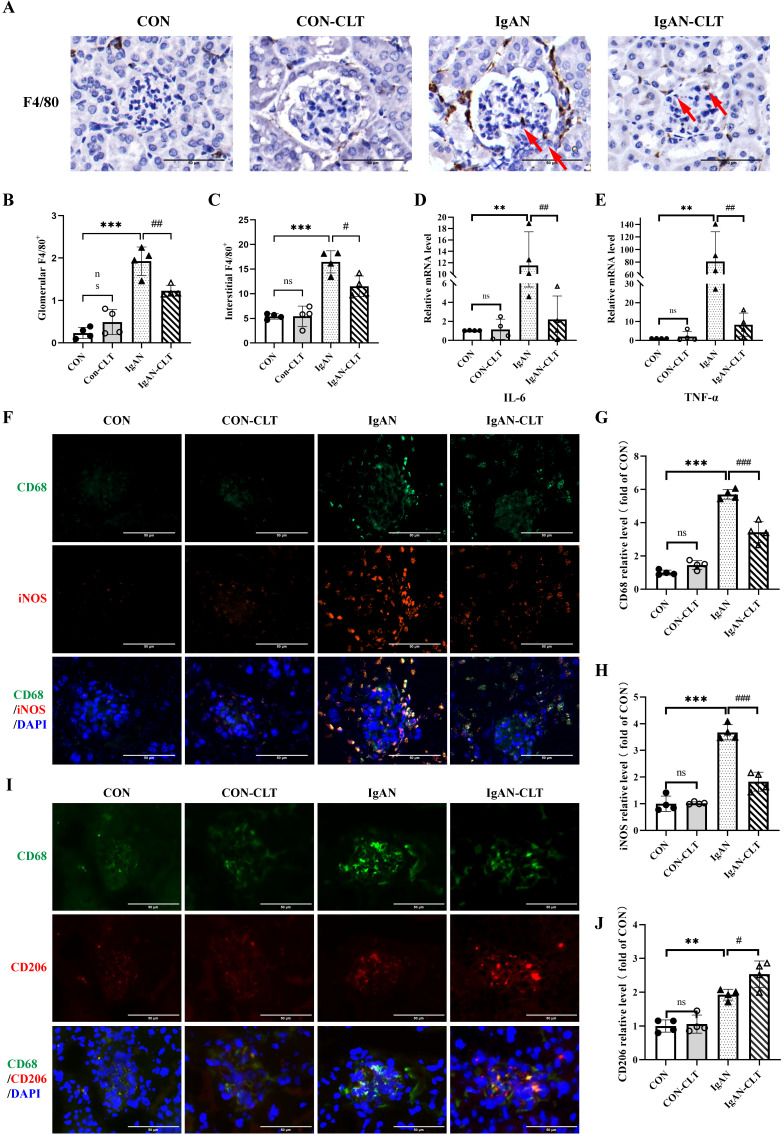
Figure 2.
CLT inhibits M1-like macrophage and the release of proinflammatory cytokine in IgAN mice. (A) Representative images of F4/80 immunohistochemical in each group kidneys (Bars=50μm), with red arrows indicating F4/80+macrophages in the glomerulus. (B, C) The quantity of F4/80+ cells in the glomerulus and renal interstitium. (D) IL-6 and (E) TNF-α mRNA levels in the mouse renal cortex. (F) Representative images of double immunofluorescence of CD68 and iNOS in each group of mice kidneys (Bars=50μm). The relative average fluorescence intensity of (G) CD68 and (H) iNOS was analyzed by ImageJ software. (I) Representative images of double immunofluorescence of CD68 and CD206 in each group of mice kidneys (Bars=50μm). (J) The relative average fluorescence intensity of CD206 was analyzed by ImageJ software. Statistical differences in multiple groups were determined by one-way ANOVA followed by Tukey's multiple comparisons. All data were presented as mean ± SD. n=4 for each group. Images were captured at ×400 magnification. **: p < 0.01, ***: p < 0.001, vs. CON. #: p < 0.05, ##: p < 0.01, ###: p < 0.001, vs. IgAN. ns: p > 0.05.

