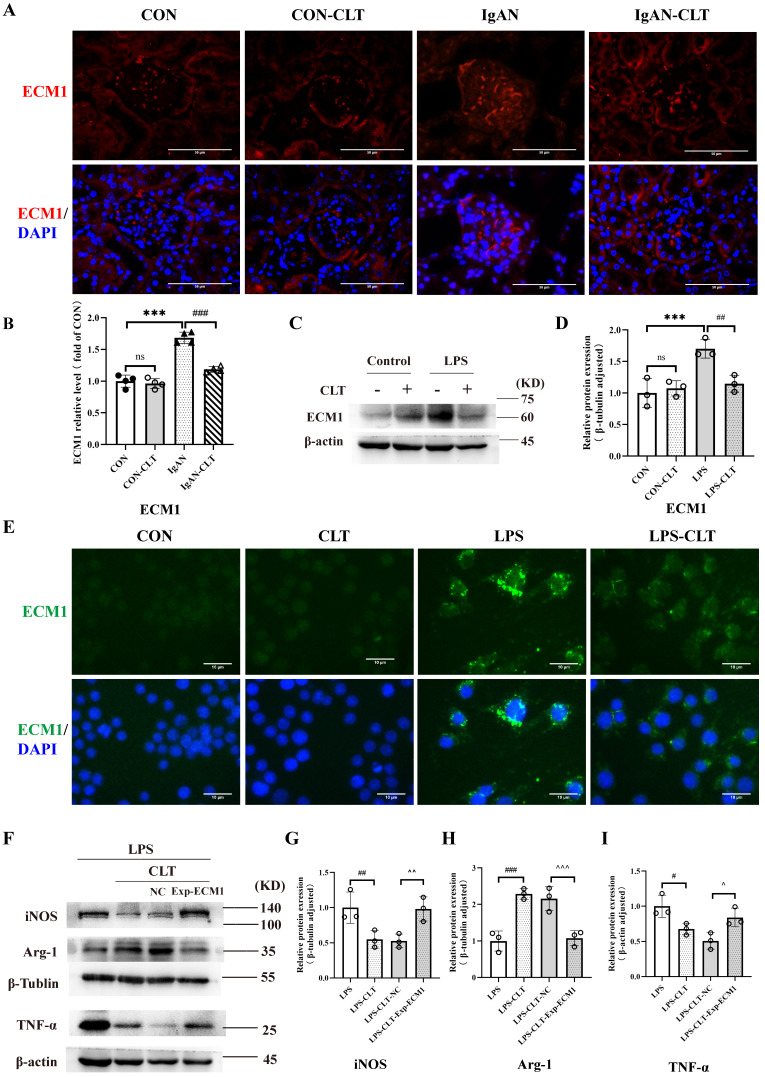
Figure 5.
CLT regulated macrophage M1-like polarization and release of proinflammatory cytokine by ECM1. (A) Representative images of ECM1 immunofluorescence staining in each group of mice kidneys (Bars=50μm). (B) The relative average fluorescence intensity of ECM1 was analyzed using ImageJ software. (C-D) Immunoblot analyses and quantitative determination of ECM1 in LPS-induced Raw 264.7 cells treated with CLT. (E) Immunofluorescence of ECM1 in Raw 264.7 cells (Bars = 10 μm). (F-I) Representative western blots and quantitative analysis of iNOS, Arg-1, and TNF-α in ECM1-overexpression Raw 264.7 cells. Statistical differences in multiple groups were determined by one-way ANOVA followed by Tukey's multiple comparisons. All data were presented as mean ± SD, n=4 for each group of mice, n=3 for each group of cells. Images were captured at ×400 magnification. *: p<0.05, ***: p < 0.001, vs. CON. #: p < 0.05, ##: p < 0.01, vs. LPS. ^p < 0.05, ^^p < 0.01 vs. LPS-CLT-NC. ns: p > 0.05.

