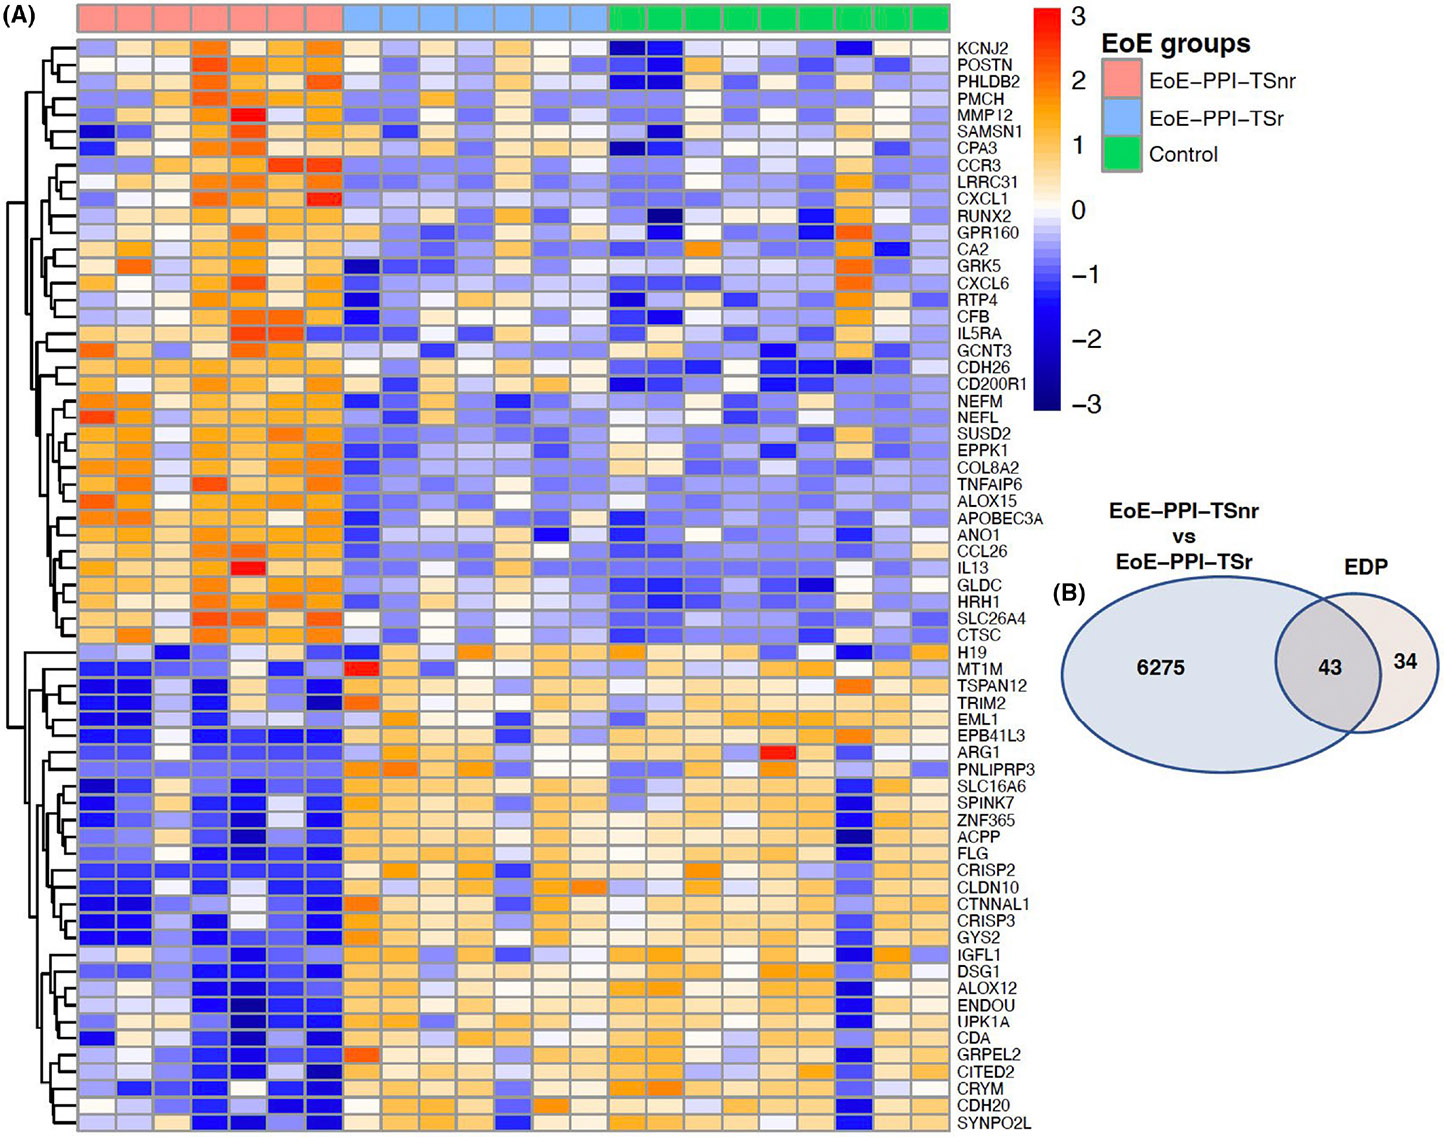
FIGURE 3.

(A) Heatmap showing the expression profile of genes in our cohort of EoE-PPI-TSnr, EoE-PPI-TSr, and controls which are included in the EoE diagnostic panel (EDP). (B) Venn diagram illustrating total number of differentially expressed genes in EoE-PPI-TSnr versus EoE-PPI-TSr and their overlap with the differentially expressed genes in the EDP panel (77 genes).
