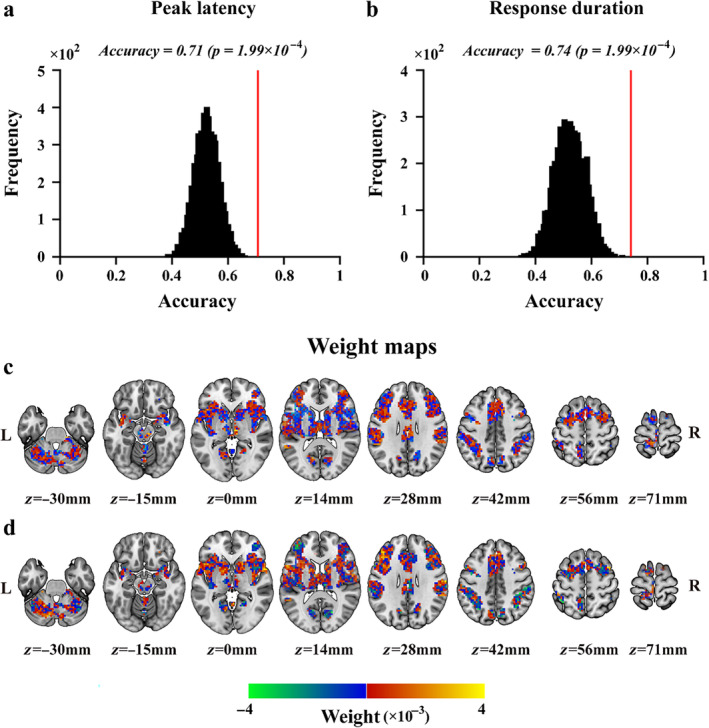
FIGURE 5.

Classification accuracies and their null distributions of “pain versus no‐pain” classifications based on peak latency (a) and response duration (b), along with their corresponding weight maps (c and d). In panels a and b, classification accuracies are indicated by the red vertical lines and the corresponding null distributions (obtained from 5000 permutations) are indicated by the black bell shapes centered around the chance level accuracy of 0.5. Panels c and d show the weight maps of the classifications based on peak latency and response duration, respectively. The sign of the SVM weight indicates the preference for pain (positive values in red‐yellow) or for no‐pain (negative values in blue‐green).
