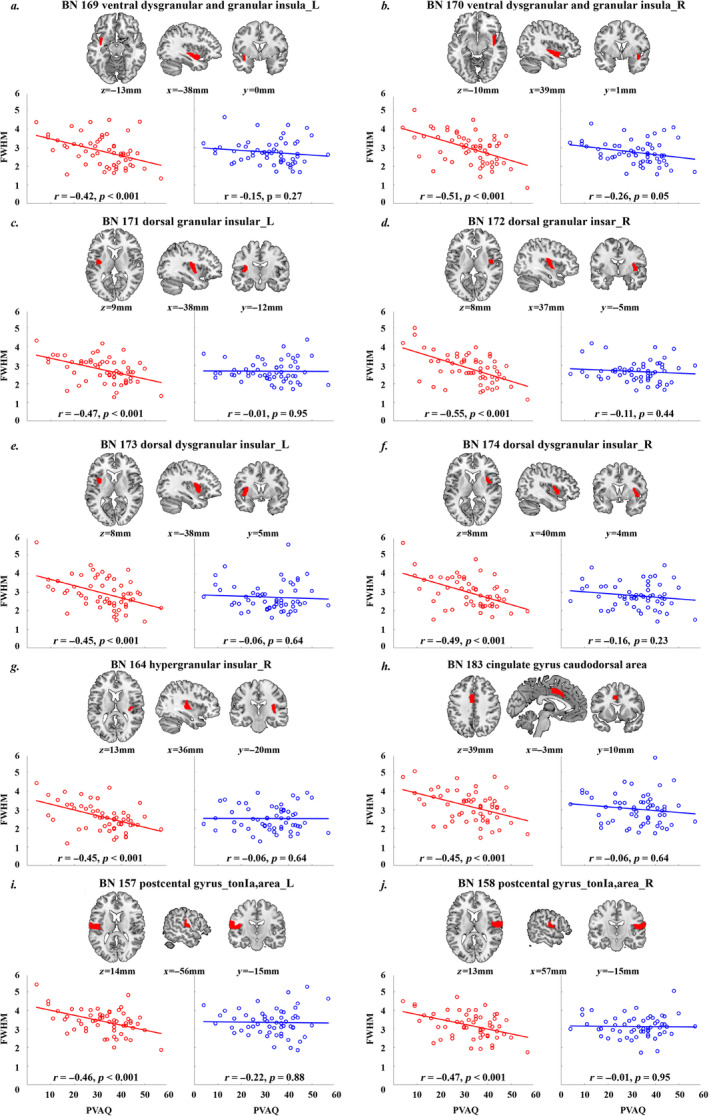
FIGURE 6.

The scatter plots for the correlations between the PVAQ score and the average FWHM of HDR for the 10 identified brain areas (p < 0.05/49 = 0.00102, Bonferroni corrected) under the painful condition (red dots and the fitted straight line) and the non‐painful condition (blue dots and the fitted straight line). The brain map above the scatter plots in each panel shows the location of the corresponding brain region: BN 169 ventral dysgranular and granular insula_L (a), BN 170 ventral dysgranularand granularinsula_R (b), BN171 dorsal granular insular_L (c), BN172 dorsal granular insular_R (d), BN173 dorsal dysgranular insular_L (e), BN174 dorsal dysgranular insular_R (f), BN164 hypergranular insular_R (g), BN183 cingulate gyrus caudodorsal area (h), BN 157 postcental gyrus_tonla,area_L (i), BN 158 postcental gyrus_tonla,area_R (j). FWHM: full width at half‐maximum; L: left; PVAQ: Pain Vigilance and Awareness Questionnaire; R: right.
