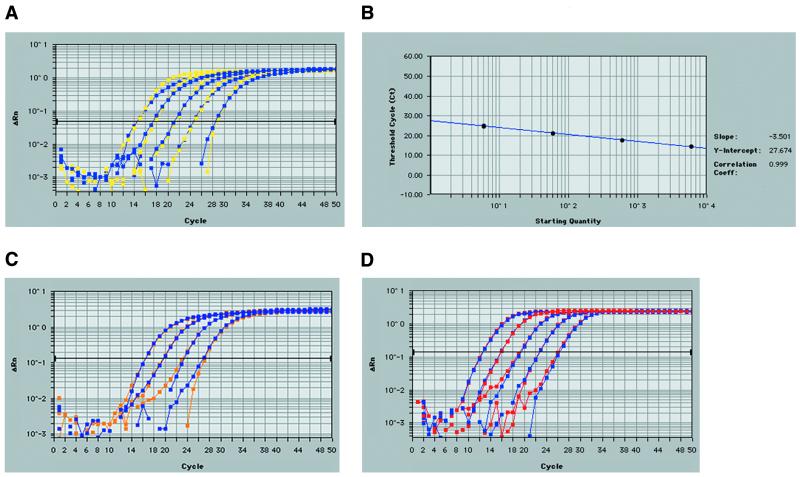
Figure 4.
Validation of TaqMan® real-time RT–PCR for quantitative detection of P.falciparum ebl. (A) Amplification plot of P.falciparum 3D7 gDNA with eba-175 and maebl TaqMan® primer/probe sets. maebl (yellow) and eba-175 (blue)-specific primer probes sets were used in the 5′ nuclease TaqMan® assay with varying gDNA concentrations (10-fold dilutions from 6 µg to 600 pg/reaction). The darkened horizontal bar represents the chosen threshold cycle (Ct) during the linear phase of the PCR. PCRs with higher initial gDNA concentrations cross the Ct at an earlier cycle number with subsequent dilutions crossing the Ct in later cycles. Due to the stringent and similar design for TaqMan® primer and probe sets, maebl and eba-175-specific products produced near exact amplification plots. These results verified an optimized PCR, achieving the theoretical gap of ~3.33 cycles per 10-fold dilution of gDNA. The primer/probe sets for baebl, ebl-1, jesebl and pebl showed similar and reproducible results. These and similar plots validated the use of each ebl primer and probe set as well as the use of gDNA to construct a standard curve. (B) A representative standard curve constructed from the eba-175 profile given in (A) with its replicate. The logarithmic plot relates starting DNA concentration (ng) versus Ct for the gDNA dilutions. Replicate values almost perfectly overlay each other (circles). A similar curve was created for each of the ebls for every TaqMan® experiment. (C) The lsa-1 (violet) and replicate (orange) show similar amplification profiles using four dilutions of gDNA. (D) As in (A), five dilutions (10-fold dilutions from 6 µg to 600 pg/reaction) of genomic DNA validate real-time quantitative RT–PCR using TaqMan® chemistry for the 18S rRNA control primer and probe set using the VIC reporter dye. The replicates shown (red and blue) almost perfectly overlay with one another indicating reproducibility. These images were taken from data analysis provided by the Sequence Detection Software (version 1.6.3 or 1.7) for the ABI Prism 7700.

