
Figure 8.
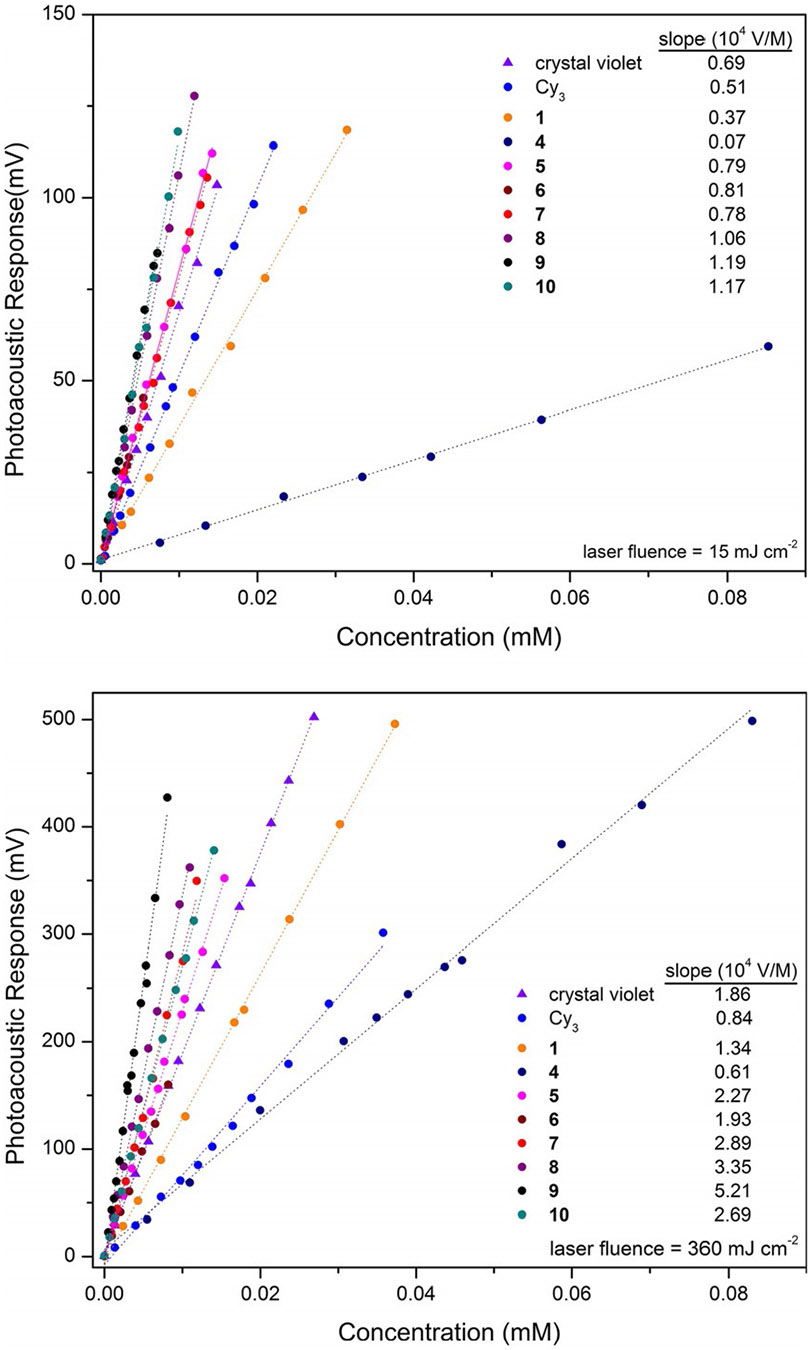
Molar photoacoustic emission of all dyes measured at low (15 mJ cm−2, top) and high (360 mJ cm−2, bottom) laser fluence. Note the larger y-axis scale used for presenting the high laser fluence data.
Official websites use .gov
A
.gov website belongs to an official
government organization in the United States.
Secure .gov websites use HTTPS
A lock (
) or https:// means you've safely
connected to the .gov website. Share sensitive
information only on official, secure websites.
Molar photoacoustic emission of all dyes measured at low (15 mJ cm−2, top) and high (360 mJ cm−2, bottom) laser fluence. Note the larger y-axis scale used for presenting the high laser fluence data.