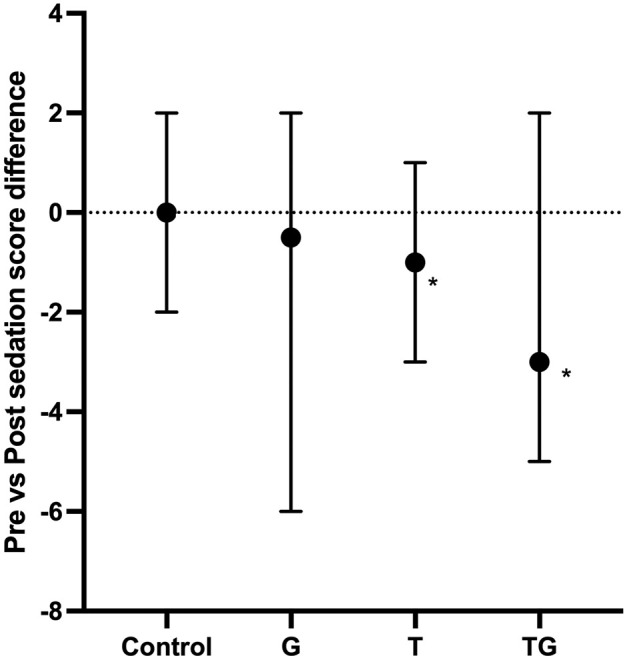
Figure 2.

Differences between sedation scores before (Pre) and 1 h after (Post) administration of trazodone at 5 mg/kg PO (T), gabapentin at 10 mg/kg PO (G), their combination (TG) or placebo (control). The sedation score was calculated on a scale of 0–12, with 0 being no sedation and 12 being profound sedation. Data are expressed as median (solid black circles) and range (whiskers). Negative values signify higher sedation scores after drug administration compared with baseline values. Significant differences between the treatment and control groups are indicated with * (P <0.05)
