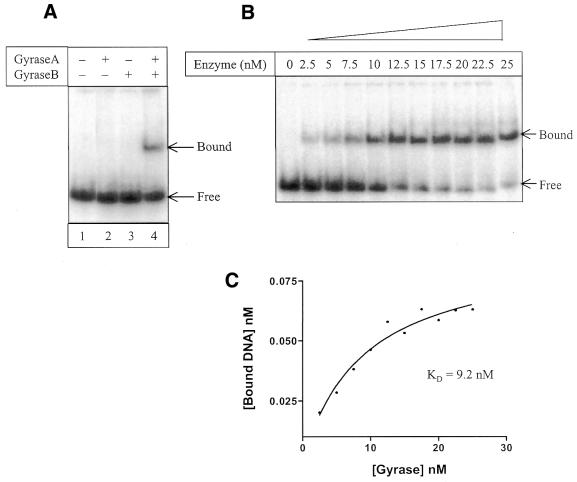
Figure 4.
DNA binding analysis of M.smegmatis DNA gyrase. EMSAs using the 240 bp labelled DNA fragment from pBR322. (A) Assay with individual subunits alone (lanes 2 and 3) or holoenzyme (lane 4). (B) Labelled DNA was incubated with varying concentrations of enzyme. The free and bound fractions of DNA were separated on a 3.5% native gel at 4°C and analysed by phosphorimager. (C) The free and bound fractions were quantitated by phosphorimager. The line drawn is the theoretical curve for the formation of a bimolecular complex between gyrase and DNA. The dissociation constant (Kd) of gyrase–DNA is shown.

