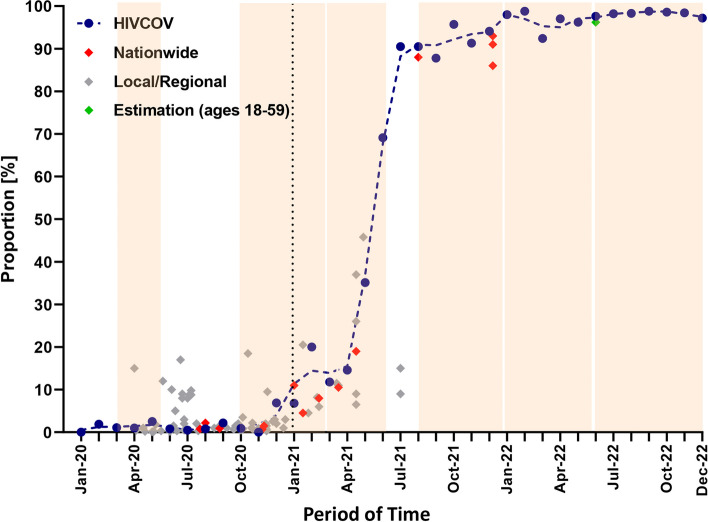
Fig. 2.
Comparison of anti-S1 seroprevalence in the HIVCOV study with data from studies of the adult general population in Germany. Data of the nationwide and local studies were previously assembled and published [27]. The dashed line indicates the trend. The dotted vertical line marks the start of the vaccination campaign. The six infection waves [30] are depicted as light brown background. The green diamond marks the estimated proportion of the German population with a previous contact to the virus or vaccine by end of May 2022, as published by Maier and colleagues [32]

