
Figure 7.
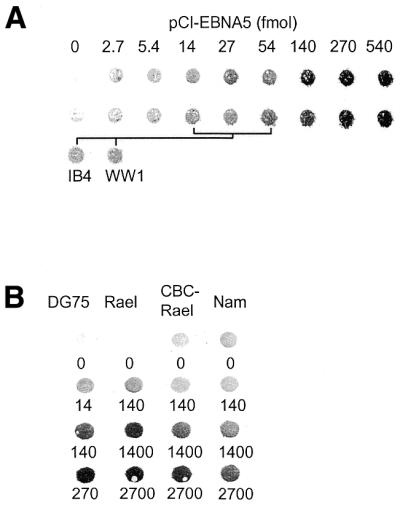
Comparative analysis of vector-induced expression of EBNA5 in DG75 cells and constitutive expression of EBNA5 in EBV-transformed B-lymphoid cell lines. (A) Analysis of the relative level of EBNA5 expression in DG75 cells transfected with different amounts of pCI-EBNA5 DNA and that in IB4 and WW1 LCLs. DG75 cells were transfected with increasing amounts of pCI-EBNA5 DNA together with 5 µg pE300CY6 DNA. The transfected cells were purified on the basis of rCD2 expression using anti-rCD2 antibody-coated magnetic beads. The relative concentration of EBNA5 protein in the cells was determined by dot immunoblot analysis. Cell extract corresponding to 50 000 cells was applied in each dot and EBNA5 expression was detected using the JF186 anti-EBNA5 antibody. The upper two rows in the figure show EBNA5 expression in two independent series of transfections of DG75 cells compared with the endogenous levels of EBNA5 expression in IB4 and WW1 cells. The amounts of pCI-EBNA5 DNA that induced EBNA5 expression levels in the transfected cells corresponding to the endogenous levels in IB4 and WW1 cells are indicated in the figure. (B) Analysis of the relative EBNA5 expression levels in DG75, Rael, CBC-Rael and Namalwa cells transfected with increasing amounts of pCI-EBNA5 DNA together with 5 µg pE300CY6 DNA. The transfected cells were purified on the basis of rCD2 expression and the relative levels of EBNA5 determined as described above. The amount of pCI-EBNA5 DNA per 5 × 10⁶ cells (in fmol) in the transfection is indicated below each dot.