

Abstract
Objective
Studies looking into patient and institutional variables linked to extended hospital stays have arisen as a result of the increased focus on severe maternal morbidity and mortality. Understanding the length of hospitalization of patients after delivery is important to gain insights into when hospitals will reach capacity and to predict corresponding staffing or equipment requirements. In Sudan, the distribution of the length of stay during delivery hospitalizations is heavily skewed, with the average length of stay of 2 to 3 days. This study aimed to investigate the use of non-parametric random effect model with Gamma distributed response for analyzing skewed hospital length of stay data in Sudan in neonatal and maternal unit.
Methods
We applied Gamma regression models with unknown random effects, estimated using the non-parametric maximum likelihood (NPML) technique [5]. The NPML reduces the heterogeneity in the distribution of the response and produce a robust estimation since it does not require any assumptions on the distribution. The same applies to the log–Gamma link that does not require any transformation for the data distribution and it can handle the outliers in the data points. In this study, the models are fitted with and without covariates and compared using AIC and BIC values.
Results
The findings imply that in the context of health care database investigations, Gamma regression models with non–parametric random effect consistently reduce heterogeneity and improve model accuracy. The generalized linear model with covariates and random effect (k = 4) had the best fit, indicating that Sudanese hospital length of stay data could be classified into four groups with varying average stays influenced by maternal, neonatal, and obstetrics data.
Conclusion
Identifying factors contributing to longer stays allows hospitals to implement strategies for improvement. Non-parametric random effect model with Gamma distributed response effectively accounts for unobserved heterogeneity and individual-level variability, leading to more accurate inferences and improved patient care. Including random effects can significantly affect variable significance in statistical models, emphasizing the need to consider unobserved heterogeneity when analyzing data containing potential individual-level variability. The findings emphasise the importance of making robust methodological choices in healthcare research in order to inform accurate policy decisions.
Keywords: non–parametric regression, Gamma distribution, Statistical model, hospitalization length
Introduction
Tang [17] pointed out that hospital length of stay, which frequently displays heterogeneity and a right-skewed distribution, is a key indicator of healthcare application. The right-skewed nature of the length of hospital stay distribution due to the longer hospital stay of a small number of patients and is often modeled using a Gamma, lognormal, or Weibull distribution [12]. The tail of the length of hospital stay distribution cannot be ignored, as this minority of patients may have booked beds for long period and reduced the capacity [16]. Williford et al., [19] remarked Gamma mixture models as useful models for exploring the length of hospital stay data since these models can analyze the complete length of hospital stay data distribution and are relatively robust to investigators’ decisions. Manning [11, 14] raised heteroscedastic retransformation issues. These issues can be avoided using a generalized linear model (GLM) with log link function and Gamma distribution [7]. Gamma mixture models are also recommended by Williford et al. [19] due to their flexibility, and there is no need for transforming the data or removing outliers to account for many outcome distribution shapes using these models, which also allow for the analysis of patients staying in the hospital for a longer time.
Ignoring the role of heteroscedasticity can lead to biased estimates of the response of interest [11]. Unobserved heterogeneity in health care research, particularly when right-skewed, presents a significant obstacle to inferring causal effects from observational data since these factors could bias treatment effect estimates and complicate matching techniques [13]. Valentelyte et al. (2023) applied quantile regression methods to analyse the heterogeneity in length of stay across different quantiles of the distribution. Their investigation confirmed a considerable degree of heterogeneity in the length of stays, suggesting that the factors influencing the length of stays vary across different regions of the distribution. Pereira et al. [15] noted that patients with similar conditions display heterogeneity in the length of their hospital stay, which may be related to several factors such as the differences in care supplied by different healthcare organisations and the different individual characteristics of patients, such as co-existent illnesses and complications.
The length of hospital stay heterogeneity makes statistical analysis difficult, limiting the use of inference approaches based on normality assumptions [2]. Using a parametric estimate of the model parameters leads to a misleading model when the distribution is not normal. This problem can be solved by performing a nonparametric maximum likelihood (NPML) estimation of the mixture distribution simultaneously with the structural model parameters [1]. The NPML methods with an efficient algorithm are considered to be fast and efficient methods for model fitting to solve a very wide range of problems. The Expectation-Maximization (EM) algorithm is an iterative process designed to maximize the log-likelihood function [4]. The EM algorithm is a widely applicable method of iteratively computing maximum likelihood (ML) estimates for a variety of incomplete data problems. However, NPML methods generalize to a wider class of models than the generalized linear models (GLMs), and provide new general computational solutions to fit a very wide range of models using latent variables [1]. NPML estimates are known to be discrete distributions over a finite number of mass-points [9, 10]. The paper employs the NPML approach to remove the linearity restriction of the distribution and makes no assumptions about the random effect in the Gamma mixture regression models.
The inclusion of relevant covariates and random effects in the model can further improve its accuracy and analysis results. Williford et al. [19] investigated the influence of adding different covariates and random effects to Gamma mixture regression models, indicating that such additions have a significant impact on the models. This highlights the importance of carefully considering covariate selection and placement to maximize model effectiveness and reliability. For example, when analysing factors influencing hospital stays, it is important to consider the hospital context because variations in practices and procedures can impact length of stay [19]. According to Pereira et al. [15], determining patient-specific factors that affect length of hospital stay allows for the implementation of effective care management strategies. To account for unobserved factors, individual variability, and potential model misspecifications, one can incorporate random effects with unknown mixing density into GLMs [5].
The purpose of this research is to evaluate how well the data set of Sudanese hospital stay in neonatal and maternal unit fit into multiple GLMs with Gamma distributed response, both with and without the inclusion of random effects and covariates. The resulting models are compared using the AIC and BIC values. The remainder of the paper is organized as follows. Section 2 addresses the Sudanese hospital stay in neonatal and maternal unit data. Section 3 provides a general description of the techniques for the Non-parametric Random Effect Models with Gamma Distribution. The findings of fitting various non-parametric random effect model with Gamma distributed response to the Sudanese Hospital Stay Data are presented in Sect. 4. Finally, Sect. 5 discusses some closing observations.
The Sudanese hospital stay in Neonatal and maternal unit data
At the Gadarif hospital in eastern Sudan, from May to December 2020, sociodemographic, clinical, and obstetrical data were collected using a questionnaire that was filled out by a direct interview [8]. These data included maternal characteristics (such as age (in years), Body mass index (BMI), residence (Rural/ Urban), education (≥ secondary level/< secondary level), and occupation (Employee/Housewives)), neonatal characteristics (such as gender, neonatal intensive care admission, neonatal death, and birth weight(kg)), and obstetrics data (e.g. gestational age at the time of delivery (GAat), parity, anaesthesia types and cesarean delivery (TypeofCD) (Emergency/Elective)). Other data [for example, postoperative maternal haemoglobin (second day), haemorrhage, postoperative fever, wound infection, endometritis, urinary tract infection, and LoS] were also gathered from 544 women with CD and medical records via a questionnaire administered by a qualified medical officer.
Methodology
In this study, a NPML estimation of a mixing distribution was used to estimate the distribution of the length of hospital stays. EM-based NPML estimation for Gamma-distributed response is carried out using the R package npmlreg [6]. The model includes unspecified random effects to account for patients who are treated in the same hospital, unobserved covariates and model misspecification.
As with general modeling, the effects of parameters depend on other covariates in the model. Changing covariates in a finite mixed regression model affects component membership and parametric effects [19]. Model selection such as stepwise was performed for GLM to select the fixed effects of the model, where covariates were added or removed from the full model until the best subset of the covariates was selected based on Akaike information criterion (AIC). Covariates GAat, Occupation, Age, Parity, BMI, TypeofCD, maternalcomlication, neonatalcomplication and kg were found to be statistically significant at conventional level. These covariates were incorporated into non-parametric random effect Gamma regression models. Adding covariates improves the length of hospital stay prediction. All categorical variables in the models are binary, with two levels only. The first category of each variable in Table 1 is considered as the reference category, while the second category is compared to the reference.
Table 1.
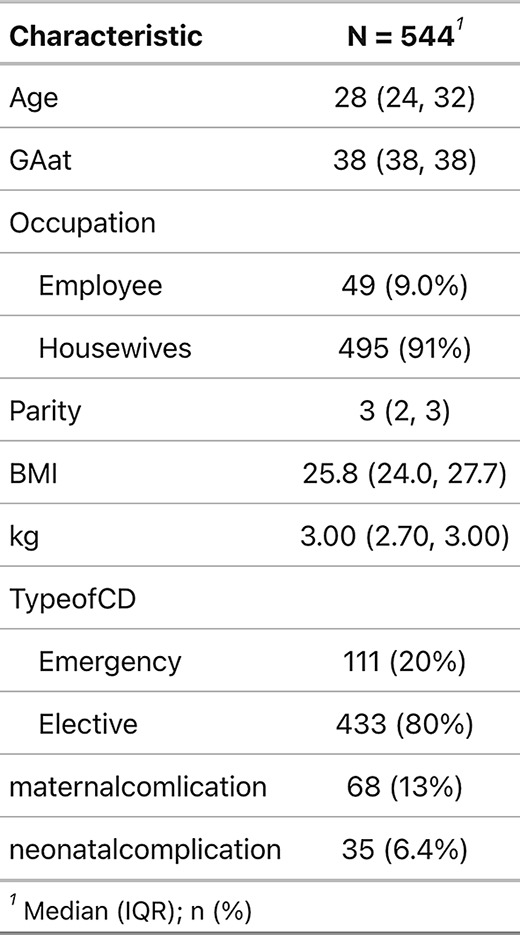
Demographic and clinical characteristics of 544 women with cesarean
Non-parametric random effect models with gamma distribution
A generalized linear model (GLM) assumes that predictors and responses are linked by a link function h [5],
 |
1 |
where yi ∼ Γ(ν,ν/µi) with shape ν, rate ν/µi, and µi is the mean of the response variable for the i − th individual; the dispersion takes the form φ = 1/ν. A random effect zi with mixing distribution g(z) is included into the linear predictor to account for the unexplained variability in the model (i.e. ηi = xTi β + zi).
The NPML approach is a flexible and reliable technique that based on the idea of approximating the mixing distribution by a finite mixture distribution and does not require any parametric assumptions about the mixing distribution [1, 9]. Using a finite mixture, the marginal probability can be approximated as.
 |
2 |
where zk are the mass points and πk their masses. Where πk capture proportions of observations which have highest posterior probability of belonging to the respective component k, and  . The log-likelihood is thus
 |
3 |
From Eq. 4, the score equations are obtained as follow
 |
4 |
The standard EM algorithm can now predict the parameters β, φk, zk, and πk simultaneously. In the E-step, weights  are modified based on the likelihood that observation i belongs to component k. In the M-step, the estimates for parameters are adjusted by fitting a weighted generalised linear model (GLM) with weights
  [5]. This methodology is implemented in the R package npmlreg [6].
Random effect with no covariates
The generalized linear model with random effect is fitted to the hospital stay data with no covariates. The model given by,
 |
5 |
where the response yi, i = 1,…n (days = length of stay), has a Gamma distribution, and zi is unknown random effect with unspecified density function g(.) that is approximated using NPML as a discrete mixture k of mass-points with masses.
Random effect with covariates
To understand the relationship between covariates and length of stay, the model in Eq. 5 is fitted to the hospital stay data with 9 covariates. The model given by,
 |
6 |
where the response (days = length of stay), yi, i = 1, …n, has a Gamma distribution, the explanatory variables xi (GAat, Occupation, Age, Parity, BMI, TypeofCD, maternalcomlication, neonatalcomplication and kg) and zi is unknown random effect with unspecified density function g(.) that is approximated using NPML as a discrete mixture k of mass-points with masses. The fitted model is a mixed model with k components, where k = 1 refers to the generalized linear model without random effect. The random effect is replaced by the constant intercept α, (i.e. g(µi) ≡ g(E(yi|β, φ)) = α + ηi ≡ α + xTi β).
Results
In this section, we analyze a data set collected on persons discharged from the Gadarif hospital in eastern Sudan using a questionnaire that was filled out by a direct interview and medical records via a questionnaire administered by a qualified medical officer. A stepwise Akaike Information Criterion (AIC) approach is used to select the optimal model fit the data. This method continuously adds or removes covariates based on their significance in improving the model’s overall fit. The data set, reduced to the nine following covariates: the maternal characteristics (such as age, BMI, and occupation), neonatal characteristics (such as gender, birth weight, neonatal intensive care admission, and neonatal death), and obstetrics data (e.g. GAat, parity, TypeofCD).
A total of 544 women with cesarean delivery (CD) were enrolled in the study. The median age of participants was 28 years (IQR: 24–32), with a gestational age at delivery of 38 weeks (IQR: 38–38). The median parity was 3 (IQR: 2–3), and the median BMI was 25.8 kg/m² (IQR: 24.0-27.7). The newborns’ median weight was 3.00 kg (IQR: 2.70-3.00). Maternal complications occurred in 68 women (13%), while neonatal complications were observed in 35 cases (6.4%). The majority of participants (91%) were housewives, with only 9% employed. Most CDs were performed electively (80%), while 20% were emergency procedures, (see Table 1).
Figure 1 shows that the distribution of length of hospital stay is skewed to the right because a small number of patients stay in the hospital for an extended period of time. The Gamma distribution is suitable choice for modelling this data due to its flexibility and ability to represent right-skewed data. Furthermore, the variance of the Gamma distribution is proportional to the mean, which is important for understanding the effects of a small number of patients with long hospital stays. The Gamma distribution has two parameters, shape and scale. The distribution’s skewness is controlled by the shape parameter, while its spread is controlled by the scale parameter. Besides, the generalized linear mixed model allows for the estimation of individual-specific random effects. These hidden factors capture the unique characteristics of each patient, accounting for unobserved differences that might influence their hospital stay. Bartels [3] highlighted that the process of clustering data into clusters produces hidden differences (unobserved heterogeneity) among clusters. These differences are reflected in differing average values of the dependent variable (length of stay in this case) across groups. Therefore, Bartels [3] pointed out that addressing unobserved heterogeneity is essential when analyzing clustered data to avoid misleading conclusions.
Fig. 1.

Histogram of the response variable days (length of stay) from the hospital stay data
Fixed effect models
We begin by modelling the hospital stay data with a fixed effect model with Gamma distributed response. The Gamma distribution is employed since it is appropriate for modelling positive, continuous data with skewness. We fit two versions of the fixed effect model: one without covariates, which only includes the intercept  , and another with covariates, which includes both the intercept and the nine selected covariates. The model highlights the importance of considering various factors, including maternal characteristics, neonatal characteristics and obstetrics data, when predicting hospital stay duration. Seven estimated parameters are highly significant (p-values < 0.05), indicating their important associations with the length of stay (see Table 2). Figure 2 plots the residuals against the fitted values of the fixed effect model with Gamma distributed response and 9 covariates. The presence of distinct residual clusters indicates that the model may not adequately capture the variability in the data. Given these non-homogeneous residuals, the normality assumption required for parametric methods may be violated. To handle this variability, random effects can be used to account for the impact of unobserved factors on the outcome variable. In contrast to parametric methods, non-parametric methods model complex relationships without making restrictive assumptions, which gives them more flexibility and predictive potential. This leads to a more robust and predictive modeling approach.
Table 2.
The parameter estimates of the fixed effect model with Gamma distributed response and 9 covariates
| Coefficients | Estimate | Std. Error | t-value | P-value |
|---|---|---|---|---|
| (Intercept) | 1.386 | 0.198 | 7.000 | 0.000 |
| Age | 0.005 | 0.002 | 2.355 | 0.019 |
| Occupation[Housewives] | 0.082 | 0.037 | 2.243 | 0.025 |
| GAat | -0.007 | 0.004 | -1.595 | 0.111 |
| Parity | -0.015 | 0.008 | -1.839 | 0.067 |
| BMI | 0.005 | 0.002 | 2.004 | 0.046 |
| kg | 0.051 | 0.017 | 3.102 | 0.002 |
| TypeofCD[Elective] | -0.132 | 0.026 | -5.068 | 0.000 |
| Maternalcomlication[No] | -0.233 | 0.032 | -7.363 | 0.000 |
| neonatalcomplication[No] | -0.296 | 0.043 | -6.821 | 0.000 |
Fig. 2.

The residuals against the fitted values of the fixed effect model with Gamma distributed response and 9 covariates
Comparison of generalized linear models with Gamma distributed response
The generalized linear fixed effect model(k = 1) gives a disparity of 989.7, with seven estimated parameters being highly significant (see Table 1). However, adding random effect to the generalized linear fixed effect model instead of the intercept α, reduces the disparity and improves the fit. Generalised linear models with Gamma distributed responses are fitted using the alldist() functions of the npmlreg package [6]. The component k is increased gradually until the best model is reached according to the model selection criteria AIC and BIC. The disparities − 2 log(L), AIC and BIC for the pure mixture model from k = 1 to 5 are shown in Table 3, with the optimal tol value for the starting points that returns minimum disparity with EM converged. It can be seen that the best AIC and BIC values of the pure mixture model (Random effect with no covariates), were found for the k = 3 model. Where component 1 captures 42% of the length of stay observations that is ranging from approximately 1 to 2 days (median = 2 days), component 2 captures 54% of the length of stay observations that is ranging from approximately 3 to 4 days (median = 3 days), and component 3 captured 4% of the length of stay observations that is ranging from approximately 5 to 6 days (median = 5.7 ≈ 6 days).
Table 3.
Comparison of results from the hospital stay data analysis. Minimal values for the model selection criteria AIC and BIC given in bold face
| model | k | tol | -2 log(L) | AIC | BIC |
|---|---|---|---|---|---|
| Fixed effect (+ no covariates) | 1 | -- | 1200.1 | 1186.987 | 1206.418 |
| Rendom effect (+ no covariates) | 2 | 0.7 | 1067.7 | 901.250 | 1086.585 |
| Rendom effect (+ no covariates) | 3 | 0.1 | 435.8 | -456.595 | 467.249 |
| Rendom effect (+ no covariates) | 4 | 0.1 | 435.8 | -454.595 | 479.847 |
| Rendom effect (+ no covariates) | 5 | 0.1 | 435.8 | -452.595 | 492.445 |
| Fixed effect (+ covariates) | 1 | -- | 989.7 | 1009.760 | 1052.707 |
| Rendom effect (+ covariates) | 2 | 0.1 | 806.6 | 84.420 | 882.178 |
| Rendom effect (+ covariates) | 3 | 0.75 | 365.1 | -469.717 | 453.258 |
| Rendom effect (+ covariates) | 4 | 0.7 | -153.5 | -1092.312 | -52.729 |
| Rendom effect (+ covariates) | 5 | 0.1 | 108.2 | -791.409 | 221.568 |
The ten models of GLMs with Gamma distribution that discussed in the previous part are compered in this section by the model selection criteria, see Table 2. The disparities (− 2 log(L)) of GLMs with no covariates are: 1200 for fixed effect GLM; 1067 for GLM with random effect (k = 2); 435.8 for GLM with random effect (k = 3, 4 and 5). The disparities (− 2 log(L)) of GLMs with 9 covariates are: 989.7 for fixed effect GLM; 806.6 for GLM with random effect (k = 2); 365 for GLM with random effect (k = 3); -153.5 for GLM with random effect (k = 4); and 108 for GLM with random effect (k = 5). The best fit for the hospital stay data were found for the generalized linear model with covariates and random effect (k = 4), that has the lowest AIC and BIC values. It is clearly that the inclusion of random effect reduces the heterogeneity. Table 4 lists the estimated coefficients for each covariate, the estimated standard error, the t-value, and the P-value of the generalized linear mixed model with (k = 4) and Gamma distributed response. The covariates with P-value less than 0.05 are considered to have an impact on the length of stay in hospitals.
Table 4.
The parameter estimates of the random effects model with Gamma-distributed response and 9 covariates
| Coefficients | Estimate | Std. Error | t-value | P-value |
|---|---|---|---|---|
| Age | -0.0002 | 0.0001 | -1.188 | 0.242 |
| Occupation[Housewives] | 0.0102 | 0.0025 | 4.086 | 0.000 |
| GAat | -0.0101 | 0.0003 | -34.034 | 0.000 |
| Parity | -0.0008 | 0.0005 | -1.465 | 0.151 |
| BMI | 0.0006 | 0.0002 | 3.421 | 0.001 |
| kg | -0.0026 | 0.0012 | -2.237 | 0.031 |
| TypeofCD[Elective] | -0.0004 | 0.0018 | -0.204 | 0.839 |
| Maternalcomlication[No] | -0.4256 | 0.0023 | -182.268 | 0.000 |
| neonatalcomplication[No] | -0.4199 | 0.0031 | -136.164 | 0.000 |
It is evident from the Fig. 3 that the data clearly reveals four distinct groups with different average lengths of stay. Figure 4 shows the histogram of the clusters in the generalized linear random effect model of hospital stay data for 2,3,4 and 5 components, respectively. It reveals that the four-component model provide the most distinct groups and the best representations of the underlying structure of the hospital stay data. This finding supports the conclusion that the four-component model is the most appropriate fit for the data, with each component representing a distinct group of patients with similar length of stay patterns. The data are grouped into four clusters, component 1 captures 3% of the length of stay observations that is ranging from approximately 1 to 3 days (median = 1.9 ≈ 2 days), component 2 captures 50% of the length of stay observations that is ranging from approximately 2 to 5 days (median = 2 days), component 3 captures 45% of the length of stay observations that is ranging from approximately 3 to 7 days (median = 3 days), and component 4 captures 2% of the length of stay observations that is ranging from approximately 5 to 7 days (median = 4.7 ≈ 5 days).
Fig. 3.

The four component of model 4 for the hospital stay data, illustrating the disparity trend in the top left, EM trajectories in the top right, empirical Bayes predictions against observed responses in the bottom left, and individual posterior probabilities in the bottom right
Fig. 4.

The histogram of the clusters in the random effects model with Gamma-distributed response of hospital stay data for 2,3,4 and 5 components
The parameter estimates for a random effects model with nine covariates and a gamma-distributed response are shown in Table 3. Among the significant coefficients, gestational age at delivery (GAat) has a negative effect on hospital stay length. This suggests that hospital stays are typically shorter for women who give birth closer to their full-term gestational age. Another factor is occupation: housewives tend to stay in the hospital longer than employed women. Additionally, higher body mass index (BMI) is associated with longer hospital stays. While increasing weight during pregnancy has a small negative effect on stay length, maternal and neonatal complications are both strong predictors of longer stays.
Incorporating random effects to account for unobserved heterogeneity significantly alters the relationships between variables and hospital stay length. In particular, variables like “Age” and ”TypeofCD” that were previously significant in Table 1 lose their significance in Table 3. In contrast, ”GAat” (Gestational Age at Admission) returns as a highly significant predictor after considering heterogeneity, indicating that its significance was previously undetected. Other variables like ”Occupation,” ”BMI,” and ”kg” became more significant after accounting for heterogeneity, demonstrating their enhanced impact on hospital stay duration when considering individual-level variability. Maternal and neonatal complications remain the strongest predictors in both models, highlighting their critical role in understanding hospital stay lengths.
Discussion
Understanding the average length of stay can assist healthcare organizations and hospitals make plans for staffing requirements and bed occupancy. It can also assist with resource allocation, such as making sure there are sufficient supplies and equipment available to support patients throughout their stay. Furthermore, knowing the variables that affect length of stay can assist healthcare professionals in identifying areas for development and putting strategies into action to cut down on unnecessary hospital stays and enhance patient outcomes.
In this paper, the theoretical research of the non-parametric random effect model with Gamma distributed response was examined, which addressed the misspecification problems in mixture distributions of the parametric maximum likelihood estimators, and adapted the use of the NPML estimators with unknown random effect. Studying the non–parametric random effect model with Gamma distributed response implies a significant reduction in the disparity and model selection criteria values and improved outcomes.
In regard to the fixed effect model, the model with and without covariates were examined using AIC and BIC values to decide whether the covariates should be included. The inclusion of the covariates improved the model’s accuracy greatly and also had a considerable impact on the analysis’s final results. Einbeck and Hinde [5], however, remarked that overdispersion occurs even though generalized linear model residuals look good. In order to improve the accuracy of the estimation of fixed effects, a generalized linear model can capture unobserved heterogeneity in the data by including a random effect term with unknown mixing densities that accounts for the unobserved variables, individual unit variability, and model misspecification.
With respect to the random effect models, replacing the intercept of the generalized linear fixed effect model by the random effect term greatly decreases the disparity. Moreover, the inclusion of covariates gives an additional reduction in the disparity. The generalized linear model with covariates and random effect (k = 4) was found to be the best fit for the hospital stay data, with the lowest AIC and BIC values (-1092.31 and − 52.72, respectively). In general, the random effects model, which accounts for individual-level variability, provides a better fit to the data than the fixed effects model. This is demonstrated by the changes in coefficient significance and effect sizes seen after moving from the fixed effects to the random effects model. For example, in the random effects model, the coefficient for “Occupation (Housewives)” has a greater relationship with hospital stay length, most likely due to the model’s ability to capture individual-level variations.
According to the findings, Sudanese hospital length of stay data is classified into four groups, with each group having an average length of hospital stay that is influenced by model parameters such as covariates: maternal characteristics (such as BMI and occupation), neonatal characteristics (such as birth weight, neonatal intensive care admission, and neonatal death), and obstetrics data (e.g. gestational age at the time of delivery). The majority of the data come from the second and third groups, with medians of two and three days, respectively. In this study, the significant impact of random effects on variable significance highlights the importance of considering unobserved heterogeneity when analysing data with individual-level variation. These findings suggest classifying women according to the estimated length of their hospital stay to offer reliable and suitable treatment according to the predicted hospitalisation time.
Limitations
While the use of a non-parametric random effects model with a Gamma-distributed response effectively addressed unobserved heterogeneity and individual variability, the study was limited by several factors. Unidentified comorbidities, variations in medical procedures, and differences in types of treatment were not included, which may have an impact on the length of hospital stays. Knowing which factors contribute to longer stays can help hospitals identify areas for improvement and implement strategies to reduce unnecessary hospital stays and improve the treatment of patients.
Conclusions
In this study, non-parametric random effect model with Gamma distributed response were used to account for unobserved heterogeneity and individual variability. This method provides more accurate conclusions and can enhance patient care by determining factors that contribute to extended stays. The addition of random factors had a significant impact on factor significance, demonstrating the need of considering unobserved heterogeneity when analysing data with potential individual-level variability.
The importance of using appropriate methodological techniques while investigating skewed data was highlighted by Valentelyte et al. (2023) in order to ensure accurate and relevant empirical evidence that would guide healthcare policy decisions. May et al. [13] found that unobserved heterogeneity continues to be a major challenge to the analysis of treatment effects on costs and other utilisation outcomes in hospital admissions, suggesting the necessity of incorporating controls for unobserved heterogeneity in research methods. By using of suitable statistical methods, such as non-parametric random effect model with Gamma distributed response, researchers can obtain a more comprehensive awareness of the factors influencing the length of hospital stay and provide evidence-based policy decisions.
The presence of many distinct residual clusters in the fixed effect model in this study suggests that unobserved heterogeneity may affect the outcome variable. This heterogeneity violates the normality assumption, which is often required for parametric models. Furthermore, even in cases when the residuals appear well-behaved, overdispersion could occur, suggesting additional unexplained variability [5]. Including random effects can help overcome these problems by accounting for unobserved variables that may affect the outcome. Non-parametric techniques provide a more flexible and predictive modelling approach by allowing complex interactions to be captured without restricting assumptions.
Hospital stay length variances between different regions can be found by including regional characteristics into the analysis. This could provide information about regional-specific factors influencing outcomes. A variance component model can be applied to divide the variation in hospital stay lengths into components due to region differences and individual variability. This can lead to a better understanding of the origins of variance.
The model selected can have a substantial impact on the inferences derived from the data, thus it is important to investigate the specific causes of changes in each variable’s significance and take into account any potential interactions or related factors that may be affecting the result. By accounting for these hidden factors, we can more effectively examine the individual contribution of each variable and find those who truly drive the outcome. Further research might identify even deeper correlations between the variables and the outcome of interest.
Acknowledgements
The authors gratefully acknowledge the financial support of the Deanship of Graduate Studies and Scientific Research at Qassim University (QU-APC-2024-9/1).
Abbreviations
- CD
Cesarean delivery
- NPML
Non-parametric maximum likelihood
- EM
Expectation-Maximization algorithm
- GLMs
Generalized linear models
- AIC
Akaike information criterion
- BIC
Bayesian information criterion
Author contributions
Conceptualization, A. A. and I. A.; methodology, A. A.; software, A. A.; validation, A. A. and I. A.; formal analysis, A. A.; investigation, A. A. and I. A.; resources, A. A. and I. A.; data curation, I. A.; writing---original draft preparation, A. A. and I. A.; writing---review and editing, A. A. and I.A.; visualization, A. A. and I. A.; supervision, A. A.; project administration, A. A. and I. A.; funding acquisition, A. A. All authors have read and agreed to the published version of the manuscript.
Data availability
Dataset is mentioned along the paper.
Declarations
Competing interests
The authors declare no competing interests.
Footnotes
Publisher’s note
Springer Nature remains neutral with regard to jurisdictional claims in published maps and institutional affiliations.
Amani Almohaimeed and Ishag Adam contributed equally to this work.
References
- 1.Aitkin M. NPML estimation of the mixing distribution in general statistical models with unobserved random effects. Statistical modelling: Proceedings of the 10th international workshop on statistical modelling innsbruck, Austria, 10-14 July, 1995;1–9. [Google Scholar]
- 2.Atienza N, ´ıa-Heras G, ~oz-Pichardo JM, JM, Villa R. An application of mixture distributions in modelization of length of hospital stay. Stat Med 2008;27(9):1403–20. [DOI] [PubMed] [Google Scholar]
- 3.Bartels B. Beyond fixed versus random effects: a framework for improving substantive and statistical analysis of panel, time-series cross-sectional, and multilevel data. Society for Political Meth 2008;9:1–43.
- 4.Dempster A, Laird N, Rubin D. Maximum likelihood from incomplete data via the EM algorithm. J Roy Stat Soc: Ser B (Methodol) 1977;39(1):1–22. [Google Scholar]
- 5.Einbeck J, Hinde J. Random effect modelling for regression models with gamma-distributed response. In M. Cronin, F. O'Sullivan, J. O'Sullivan, & K. R. Choudhury (Eds.), CASI 2006 : Conference on Applied Statistics in Ireland (75–76).
- 6.Einbeck J, Darnell R, Hinde J. npmlreg: Nonparametric Maximum Likelihood Estimation for Random Effect Models. R package version 0.46-5. 2018, https://CRAN.R-project.org/package=npmlreg
- 7.Faddy M, Graves N, Pettitt A. Modeling length of stay in hospital and other right skewed data: comparison of phase-type, gamma and log-normal distributions. Value Health 2009;12(2):309–14. [DOI] [PubMed] [Google Scholar]
- 8.Hassan B, Mandar O, Alhabardi N, Adam I. Length of Hospital Stay After Cesarean Delivery and Its Determinants Among Women in Eastern Sudan. Int J Women’s Health 2022;14:731–8. [DOI] [PMC free article] [PubMed]
- 9.Laird N. Nonparametric maximum likelihood estimation of a mixing distribution. J Am Stat Assoc 1978;73(364):805–11. [Google Scholar]
- 10.Lindsay BG. The geometry of mixture likelihoods: a general theory. annals Stat 1983;11(1):86–94.
- 11.Manning WG. The logged dependent variable, heteroscedasticity, and the retransformation problem. J Health Econ 1998;17(3):283–95. [DOI] [PubMed] [Google Scholar]
- 12.Marazzi A, Paccaud F, Ruffieux C, Beguin C. Fitting the distributions of length of stay by parametric models. Med Care 1998;36(6):915–27. [DOI] [PubMed] [Google Scholar]
- 13.May P, Garrido MM, Cassel JB, Morrison RS, Normand C. Using length of stay to control for unobserved heterogeneity when estimating treatment effect on hospital costs with observational data: issues of reliability, robustness, and usefulness. Health Serv Res 2016;51(5):2020–43. [DOI] [PMC free article] [PubMed] [Google Scholar]
- 14.Mullahy J. Much ado about two: reconsidering retransformation and the two- part model in health econometrics. J Health Econ 1998;17(3):247–81. [DOI] [PubMed] [Google Scholar]
- 15.Pereira SL, Silva TPRD, Moreira AD, Novaes TG, Pessoa MC, Matozinhos IP, Couto RC, Pedrosa TM, Matozinhos FP. Factors associated with the length of hospital stay of women undergoing cesarean section. Rev Saude Publica 2019;53:65. [DOI] [PMC free article] [PubMed] [Google Scholar]
- 16.Rees EM, Nightingale ES, Jafari Y, Waterlow NR, Clifford S, B Pearson CA, et al. COVID-19 length of hospital stay: a systematic review and data synthesis. BMC Med 2020;18:270. 10.1186/s12916-020-01726-3. [DOI] [PMC free article] [PubMed] [Google Scholar]
- 17.Tang X. Modeling hospital length of stay and cost with heterogeneity. Doctoral thesis, Michigan State University, Statistics 2011.
- 18.Valentelyte, Gintare DA, McNamara, Sorensen J. Exploring heterogeneity in hospital length of stay of patients admitted for emergency abdominal surgery in Ireland: A quantile regression approach. Med Res Archives 2023;12(11).
- 19.Williford E, Haley V, McNutt L-A, Lazariu V. Dealing with highly skewed hospital length of stay distributions: The use of Gamma mixture models to study delivery hospitalizations. PLoS ONE 2020;15(4):e0231825. 10.1371/journal.pone.0231825. [DOI] [PMC free article] [PubMed] [Google Scholar]
Associated Data
This section collects any data citations, data availability statements, or supplementary materials included in this article.
Data Availability Statement
Dataset is mentioned along the paper.