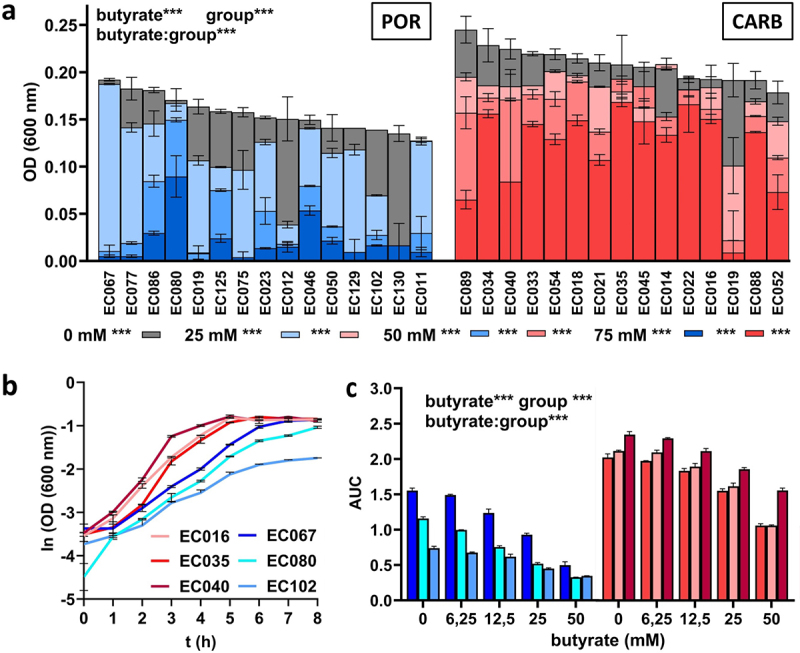
Figure 1.

Batch growth of POR (blue) and CARB (red) strains at different concentrations of butyrate (0 mM, 25 mM, 50 mM and 75 mM) under anaerobic conditions. Final growth (OD 600) after 48 h (n = 15 strains for each group) are shown in panel a, whereas growth curves of three selected POR and CARB strains at 0 mM butyrate are given in panel b. The influence of butyrate on growth dynamics based on the area under the curve (AUC) calculations from growth curves for the selected strains is given in panel c. All individual growth curves are given in Figure S3. The mean of replicate samples (n = 2) is given, where error bars display standard deviations. Statistical calculations are based on two-way ANOVA analyses with Tukey’s HSD post-hoc testing, where “butyrate” refers to the effect of butyrate, “group” describes the effect of the resistance mechanism and “butyrate:group” gives their interaction. *, **, ***; p < .05, p < .01, p < .001. Statistics of post-hoc testing in panel a are given as follows: results right of the butyrate concentration signify difference between groups, whereas comparisons of each concentration to 0 mM butyrate within each group is given next to color-coded boxes.
