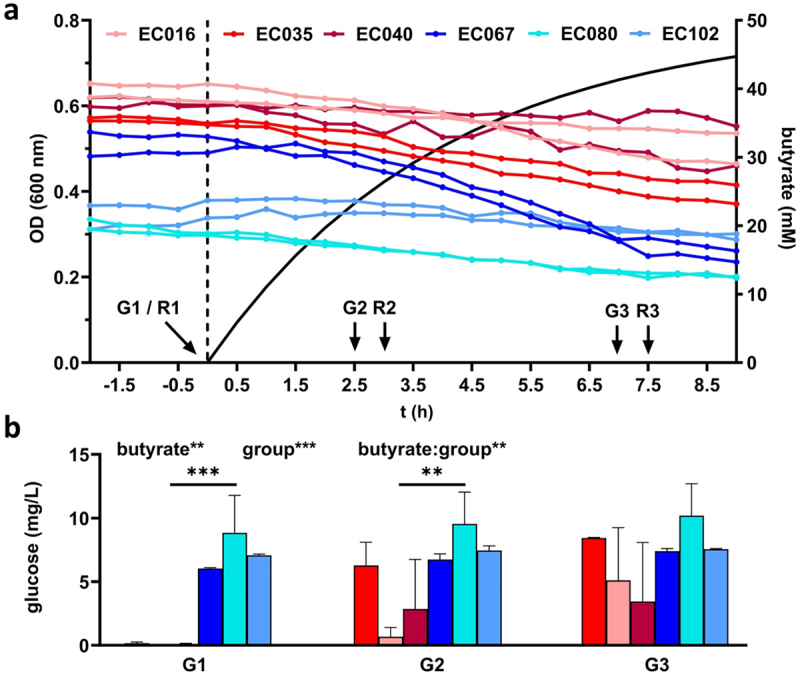
Figure 2.

Continuous culture growth of three POR (blue) and three CARB (red) strains under anaerobic conditions. Panel a gives the optical density of cultures in steady state and during butyrate wash-in (separated by the dashed line; calculated butyrate concentration is shown as solid black line). Sampling points for RNASeq (R1-R3) and glucose measurements (G1-G3) are indicated. The amount of residual glucose concentrations in reactors is displayed in panel b (the mean and standard deviation are given based on replicate (n = 2) measurements for each culture). Statistical calculations are based on two-way ANOVA analyses with Tukey’s HSD post-hoc testing, where “butyrate” refers to the effect of butyrate, “group” describes the effect of the resistance mechanism and “butyrate:group” gives their interaction. *, **, ***; p < .05, p < .01, p < .001.
