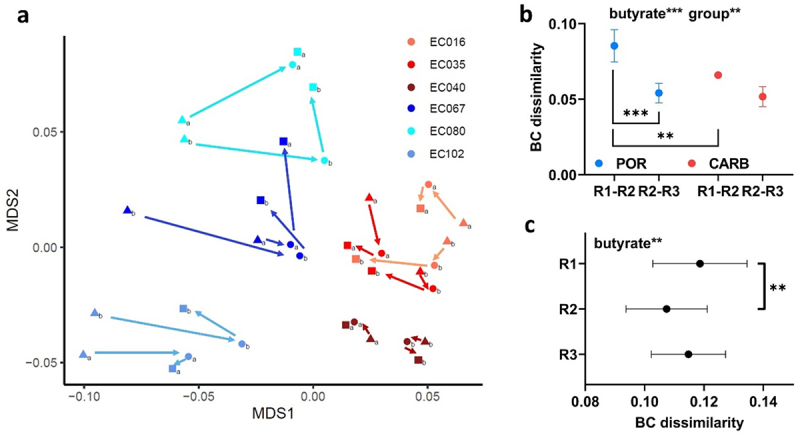
Figure 3.

Gene-expression analysis of POR (blue) and CARB (red) strains during anaerobic continuous culture growth in steady state and during butyrate wash-in (two time-points). In panel a ordination analysis based on metric multidimensional scaling (MDS) analysis and Bray Curtis (BC) dissimilarity is given; results for steady state (0 mM butyrate; triangle; R1) and at butyrate concentrations of 25 mM (dot; R2) and 43 mM (square; R3), respectively, are displayed. BC dissimilarities between R1 and R2 and for R2 to R3 within strains of the two groups are shown in panel b, whereas dissimilarities between POR and CARB strains of the three time-points are given in panel c. The mean and standard deviation are shown. Statistical calculations are based on two-way ANOVA analyses with Tukey’s HSD post-hoc testing where “butyrate” refers to the effect of butyrate and “group” describes the effect of the resistance mechanism. *, **, ***; p < .05, p < .01, p < .001.
