. 2024 Oct 24;12(10):e009416. doi: 10.1136/jitc-2024-009416

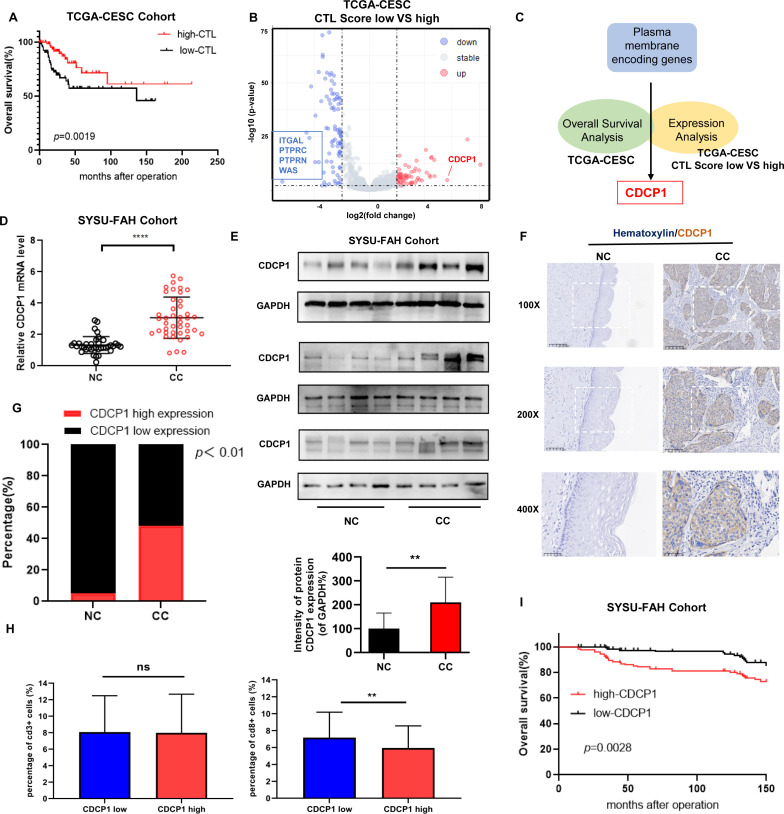
Figure 1. Identified CDCP1 correlated with poor prognosis and involved in regulating CTL function in cervical cancer. (A) Kaplan-Meier survival curves showing the overall survival of patients based on CTL scores (average expression of CD8A, CD8B, GZMA, GZMB, and PRF1) in TCGA-CESC(The Cancer Genome Atlas-Cervical squamous cell carcinoma and endocervical adenocarcinoma) Cohort. The log-rank test was used to determine the statistical significance of the difference between CDCP1 high/low expression groups, with p<0.05 considered statistically significant. (B) Volcano plot depicting the analysis of differentially expressed proteins between the CTL low-score group and the CTL high-score group. Each point corresponds to a gene, with genes exhibiting significant differential expression highlighted in red (upregulated in the CTL low-score group) and blue (downregulated in the CTL low-score group). Genes with |log2FC| greater than 2 and p<0.01 are considered significantly differentially expressed. Genes encoding membrane proteins that show significant differential expression are specifically labeled, including ITGAL, PTPRC, PTPRN, WAS, and CDCP1. (C) Schematic representation of systematic screening for immunotherapy targets in cervical cancer using the TCGA database. Through survival analysis and differential gene analysis based on immune scores from the TCGA cervical cancer dataset, membrane protein-coding genes associated with patient prognosis and low CTL scores were identified as potential targets for immunotherapy. (D) qRT-PCR analysis of CDCP1 mRNA expression levels in various patients sample.(E) Western blot analysis of NC (n=12) and CC (n=12) tissue samples. (F) Representative IHC images of CDCP1 staining in the NC and CC tissue samples. Bar in ×100, ×200, ×400 magnifications=200 µm, 100 µm, 50 µm, respectively. (G) Quantification of low and high CDCP1 expression percentages in the NC (n=30) and CC (n=176) groups based on the IHC staining results. Data are mean±SEM. Significance was determined using Student’s t-test, “ns”: not significant, **p<0.01, ****p<0.0001. CC, cervical cancer (n=56); CTL, cytotoxic T lymphocyte; IHC, immunohistochemistry; NC, normal cervix (n=35).

Figure 1