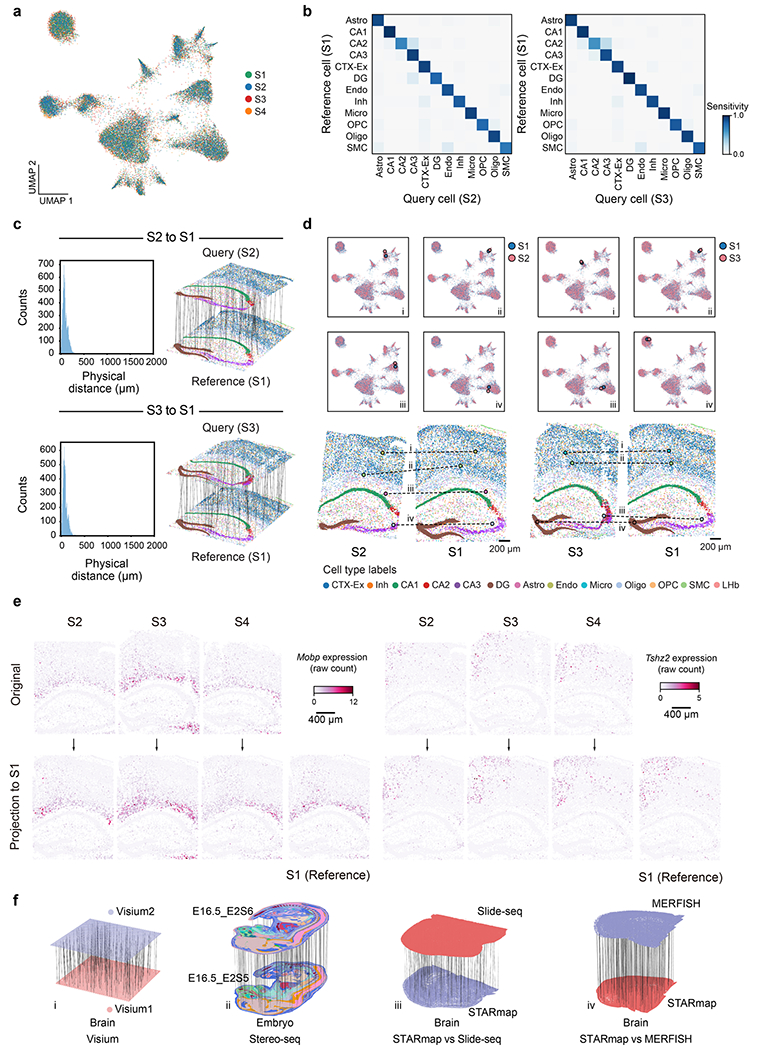
Extended Data Fig. 7 |. CAST Projection accurately preserves gene expression and spatial relationships in cells across samples.

a, UMAP of Combat30 and Harmony31 integrated embedding across S1–S4 samples (control samples) shows that the 4 samples are well integrated in different clusters. Different colors represent different samples. b, Confusion matrix of the projection performance (S2 to S1, True positive rate (TP) = 0.88; S3 to S1, TP = 0.91). The cell types with more than 10 cells in the reference sample are visualized. c, Left panel: The distribution of the physical distance in the spatial single-cell projection of the S2 to S1 (top) and S3 to S1 (bottom). Right panel: Schematic for CAST Projection results. Dashed lines (100 randomly sampled alignment pairs for visualization) connect cells from the query sample (top panel: S2, bottom panel: S3) with its destination cell in the reference sample (S1). d, CAST Projection assignment examples between S2 to S1 (left panel) and S3 to S1 (right panel) in the UMAP plots (top, S2 and S3, light red; S1, blue) and real samples (bottom, the colors of the cells are colored by cell types). e, Mobp and Tshz2 gene expression (raw count) profile in the original samples (top, S2–S4) and projected samples (bottom). f, CAST Projection is applicable across major spatial technologies and organs. i, Visium (Visium1: Mouse Brain Coronal Section 1; Visium2: Mouse Brain Coronal Section 2); ii, Stereo-seq; iii, STARmap (STARmap_mouse1) versus Slide-seq; iv, STARmap (STARmap_mouse1) versus MERFISH. CAST Projection preserves original single-cell resolution on mouse half brain and whole mouse embryo samples. Dashed lines (200 randomly sampled assignment pairs for visualization) connect cells from the query sample with its destination cell in the reference sample. In ii, the cells are colored by cell labels in the initial study.
