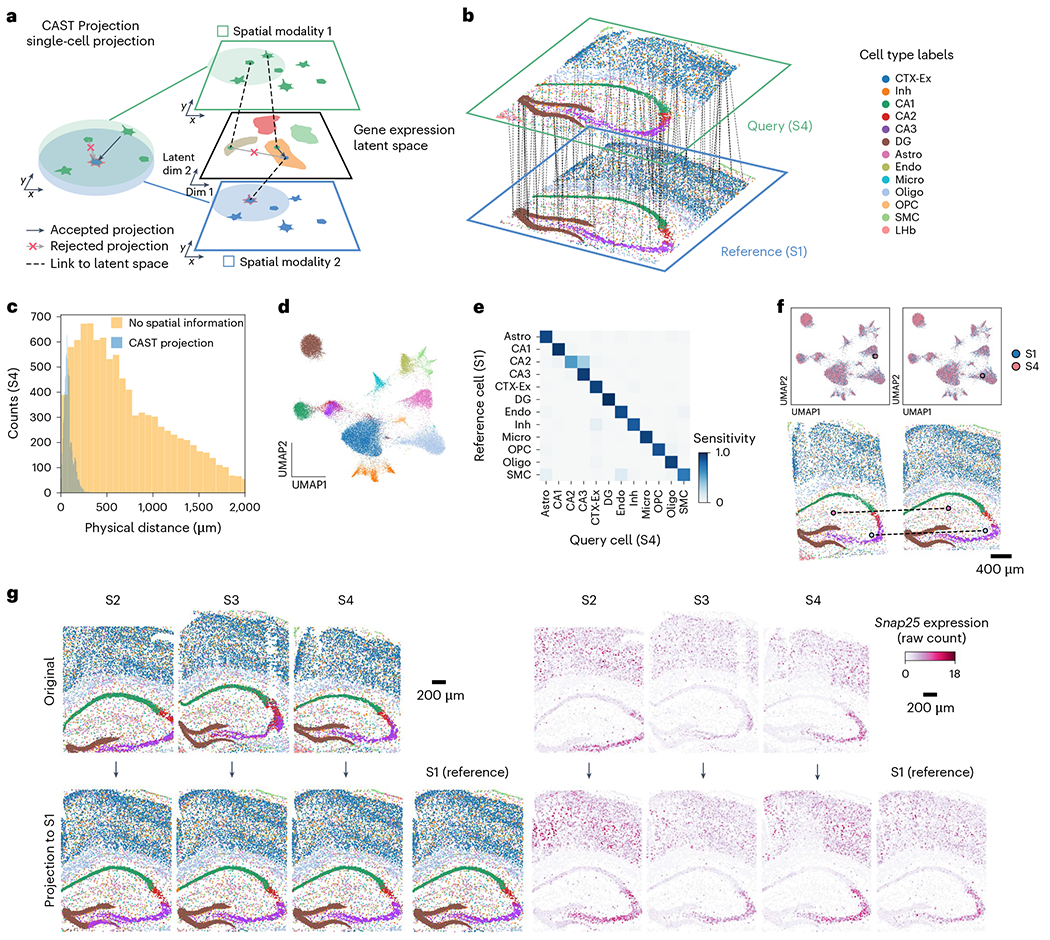
Fig. 5 |. CAST Projection enables single-cell integration of spatial omics data across multiple samples.

a, Strategy of the spatially and single-cell resolved cell assignment used by CAST Projection. b, Schematic for CAST Projection results. Dashed lines (100 randomly sampled assignment pairs for visualization) connect cells from the query sample (S4) with its destination cell in the reference sample (S1). Colors represent cell types. c, The distribution of the physical distances in the spatial single-cell projection of the S4 to S1. The blue is the CAST Projection strategy, while the yellow is the strategy that projects the query cell with the closest cosine distance to each reference cell without spatial constraints (same as Supplementary Fig. 9). d, UMAP of the batch-corrected latent space across S1–S4 samples (control samples). Colors follow figure legends in b. e, Confusion matrix of CAST Projection (S4 to S1, true positive rate of 0.91). To analyze cell types with an adequate sample size, we filtered out those that have fewer than ten cells in the reference sample. f, CAST Projection assignment examples from S4 (query sample, pink) to S1 (reference sample, blue) in the UMAP plot (top) and spatial coordinates (bottom; colors follow figure legends in b). g, CAST Projection reconstructs one sample with multiple datasets. Cells are colored by cell types (left) (colors follow figure legends in b); the Snap25 gene expression (raw count) profiles (right) in the original samples (top, S2–S4) and projected samples (bottom).
