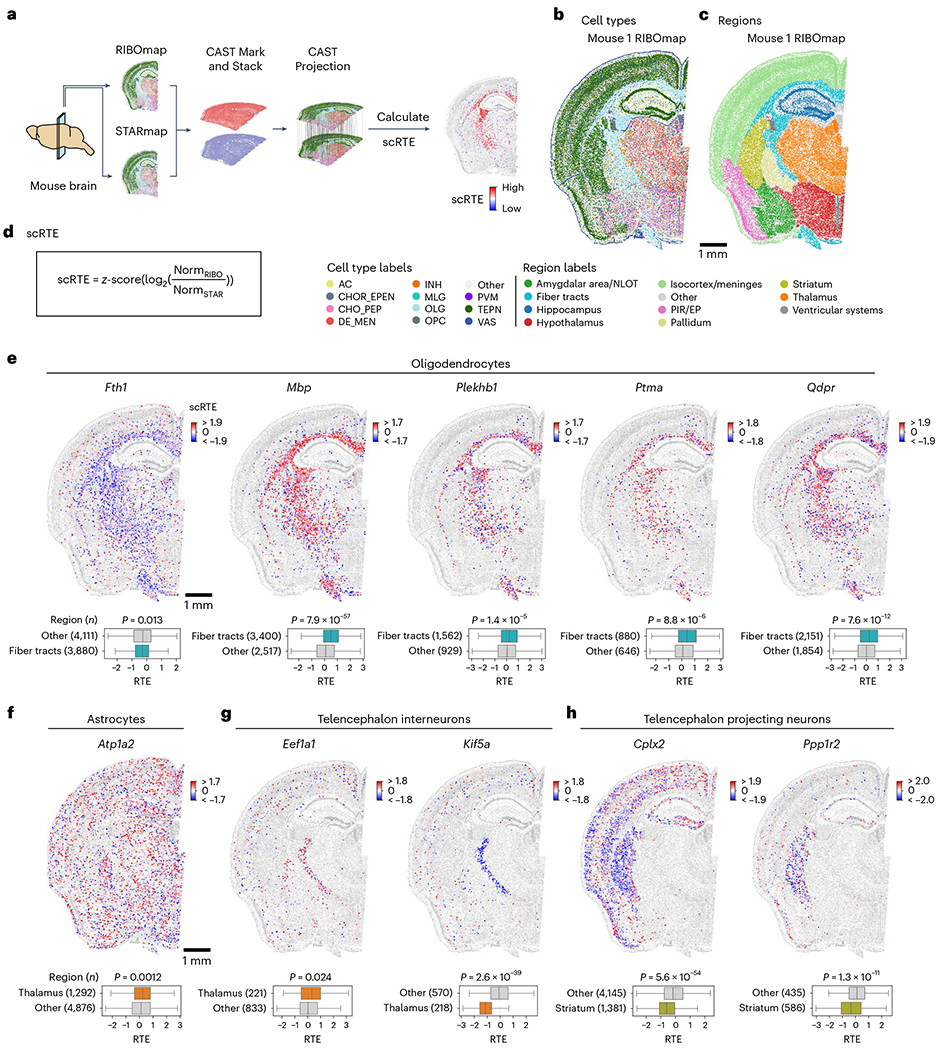
Fig. 6 |. Single-cell resolved spatial–spatial integration of transcriptomics and translatomics reveals the ubiquitous heterogeneity of translation efficiency across cell types and brain regions.

a, Schematic workflow for calculating scRTE profiles of the mouse brain. The four-sample dataset is composed of two adjacent half-brain slices taken from two different mice. Of the two adjacent slices, one was measured by RIBOmap and the other was measured by STARmap. b,c, Cell type and molecular tissue region profiles of the Mouse 1 RIBOmap sample (reference sample used in CAST Projection). AC, astrocyte; CHOR_EPEN, astro-ependymal cell; CHO_PEP, cholinergic, monoaminergic and peptidergic neuron; DE_MEN, di/mesencephalon neuron; INH, telencephalon interneuron; MLG, microglia; OLG, oligodendrocyte; PVM, perivascular macrophage; TEPN, telencephalon-projecting neuron; VAS, vascular cell. d, scRTEs were calculated using the formula. e–h, Spatially resolved and cell-type-specific scRTE profiles in Mouse 1. Cells of the annotated cell type with available scRTE values are colored by scRTE levels, other cells are colored gray. The boxplots with Kruskal–Wallis tests were used to evaluate the differences across the groups. The middle line indicates the median; the first and third quartiles are shown by the lower and upper lines, respectively; and the upper and lower whiskers extend to values not exceeding 1.5 × IQR.
