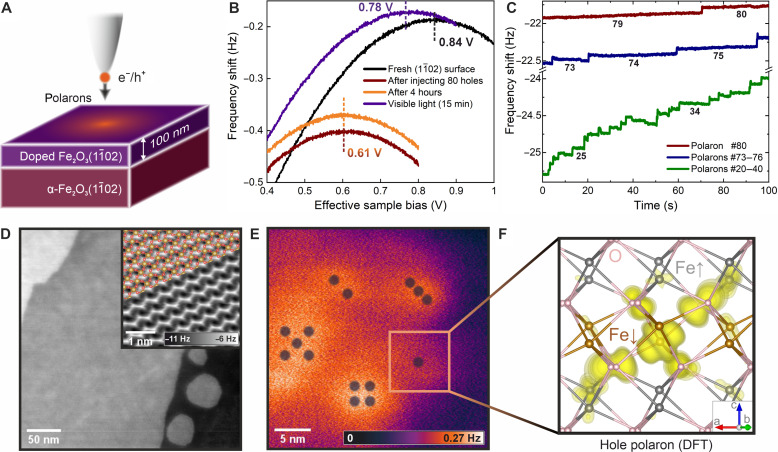
Fig. 1. Charge injection in hematite.
(A) Sketch of the experimental setup. (B) Kelvin parabolas showing the LCPD of the pristine surface (black) after injecting ~80 holes (red) into a 0.1% Ni-doped surface, after waiting for 4 hours (orange), and after illuminating the surface by visible light (violet). (C) Time dependence of the frequency shift when injecting holes into the surface at effective VS = −1.2 V; each jump indicates formation of one individual hole polaron. (D) Topographic noncontact (nc)-AFM image of the surface obtained at a constant detuning of −0.57 Hz, A = 600 pm, and VS = 80 mV. The inset shows an atomically resolved constant-height nc-AFM image, overlaid with the structural model. (E) Map of electrostatic forces induced by various numbers of hole polarons injected into the surface at locations marked by the respective numbers of dots. (F) Calculated charge densities of a single hole polaron in bulk hematite. O atoms are shown in pink and Fe in brown and gray to distinguish between opposite orientations of the local magnetic moments. All experimental data were measured at T = 4.7 K.

