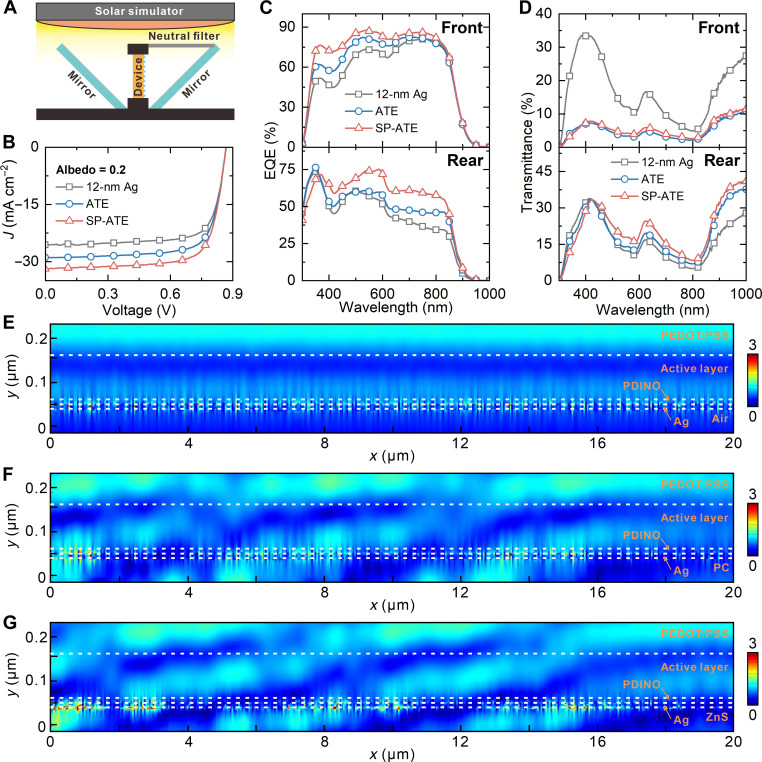
Fig. 4. Photovoltaic performance of bifacial OSCs.
(A) Schematic diagram of measurement system. (B) J-V curves of bifacial OSCs under the AM 1.5G illumination with a power intensity of 100 mW cm−2. The albedo factor is 0.2. (C) EQE spectra and (D) transmission spectra of bifacial OSCs under front (top) and rear (bottom) illumination. Simulated electric field distribution profiles of bifacial OSCs based on (E) 12-nm Ag, (F) ATE, and (G) SP-ATE. Front and rear light sources with a power intensity ratio of 1:0.2 and a wavelength of 500 nm were applied.

