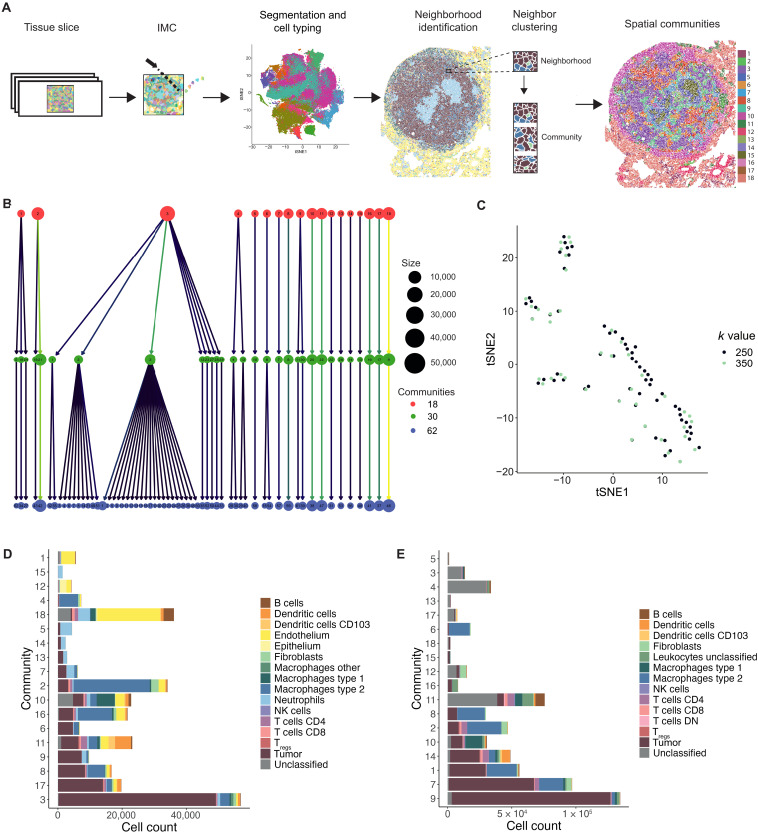
Fig. 1. Clustering of cells based on their neighbors yield spatial communities.
(A) Workflow of generating spatial communities using the data generated from lung tissue slices. (B) Cluster tree of 62 communities generated using Rphenograph with a k-input value of 250, agglomerated to 30 communities and subsequently agglomerated again to 18 communities, where each circle represents a community and lines indicate communities that were merged during agglomeration. (C) tSNE plot of 62 communities generated with a k-input value of 250 and 47 communities generated with a k-input value of 350 into Rphenograph using dataset 1, where tSNE analysis was run on the basis of the proportion of each cell type contributing to each community. (D and E) Eighteen spatial communities generated from clustering based on neighbor proportions of each cell type for (D) dataset 1 and (E) dataset 2, with the size of each bar representing cell count of that community and colors indicating the contribution of each cell type. Bars are ordered by decreasing tumor cell count. NK, natural killer; DN, double negative.

