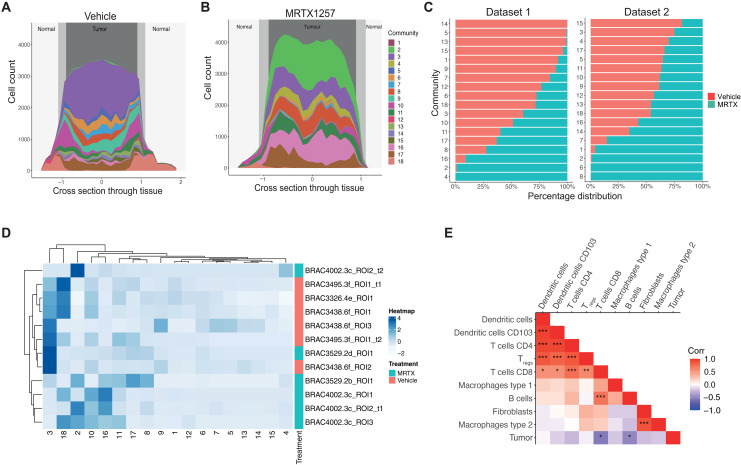
Fig. 2. Spatial communities reflect refined tissue architecture and have functional relevance.
(A and B) Cell count per community relative to cross section through the tissue, where 0 represents the center point of the tumor in (A) vehicle and (B) MRTX1257 treatment settings. (C) Percentage distribution of each community across vehicle (left) and MRTX1257 (right) treatment groups. Bars are ordered by increasing percentage distribution in vehicle setting. (D) Hierarchical clustering of community proportion per ROI for dataset 1, with the use of dendrograms to show relationships between similar ROIs, similar communities, and community distribution across the treatment groups. (E) Pearson correlation calculation on the proportion of each cell type pair within each community. *P < 0.05, **P < 0.01, and ***P < 0.001. Cell types were clustered on the basis of correlation value. MRTX, MRTX1257.

