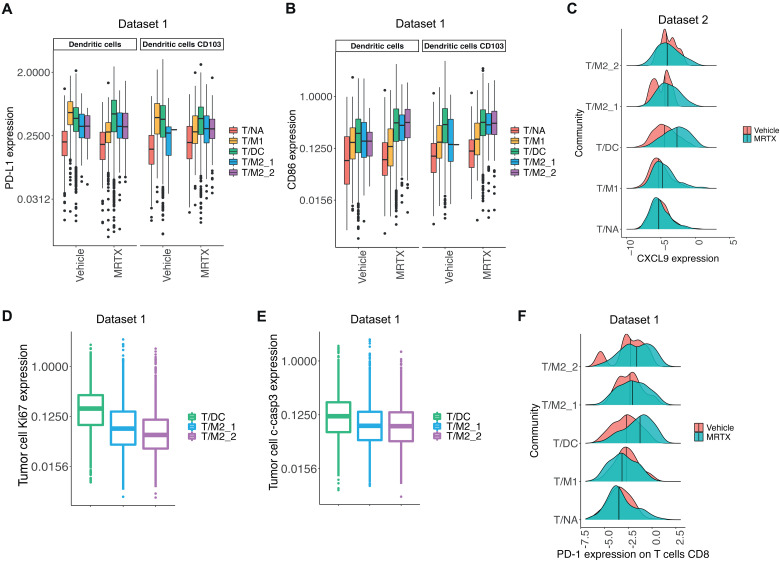
Fig. 4. T cell–rich communities respond differently to KRAS-G12C inhibition.
(A and B) Mean expression of (A) PD-L1 and (B) CD86 on DCs and CD103+ DCs in T/NA, T/M1, T/DC, T/M2_1, and T/M2_2 communities following vehicle and MRTX1257 treatments for dataset 1 only. Values were log2 scaled. (C) Mean expression of CXCL9 on DCs, CD103+ DCs, macrophages type 1, and macrophages type 2 combined for T/NA, T/M1, T/DC, T/M2_1, and T/M2_2 communities in vehicle- and MRTX1257-treated groups in dataset 2. Values were log2 scaled. Center line shows median expression for each treatment group. (D and E) Mean expression of (D) Ki67 and (E) c-casp3 on tumor cells in T/DC, T/M2_1, and T/M2_2 communities following treatment with MRTX1257 for dataset 1. Values were log2 scaled. (F) Mean expression of PD-1 on CD8+ T cells in communities T/NA, T/M1, T/DC, T/M2_1, and T/M2_2 in vehicle- and MRTX1257-treated groups for dataset 1. Values were log2 scaled. Center line shows median expression for each treatment group. MRTX, MRTX1257.

