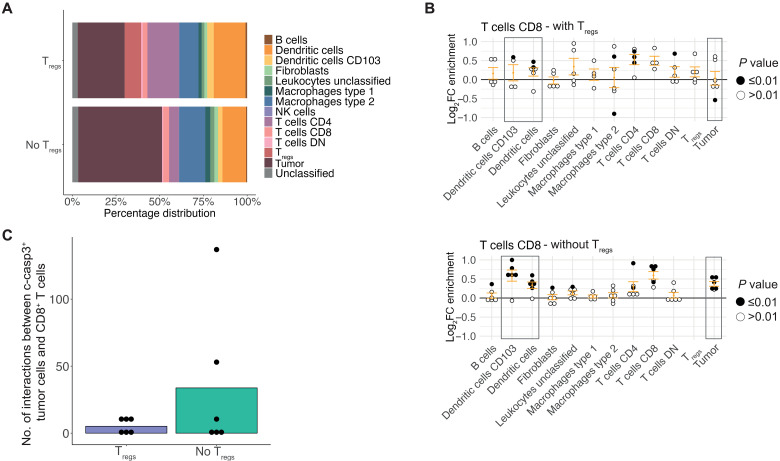
Fig. 6. Tregs dampen local antitumoral immune responses.
(A) Percentage distribution of cell types contributing to neighborhoods with Tregs (“Tregs”) and neighborhoods without Tregs (“No Tregs”) within the T/DC community following treatment with MRTX1257. (B) Log2 fold changes in enrichment from neighbouRhood analysis for CD8+ T cells in Tregs (top) and no Tregs (bottom) neighborhoods within the T/DC community following treatment with MRTX1257. Filled circles represent images from which enrichment value was statistically significant compared to randomization of the spatial arrangements within the T/DC community following treatment with MRTX1257 for dataset 2. (C) Number of times a c-casp3+ tumor cell is found in the 15-pixel neighborhood of a CD8+ T cell within the T/DC community, compared across Treg and no Treg neighborhoods in dataset 2, averaged per ROI. Count is relative to the proportion of tumor cells that were c-casp3+ in Treg versus no Treg groups.

