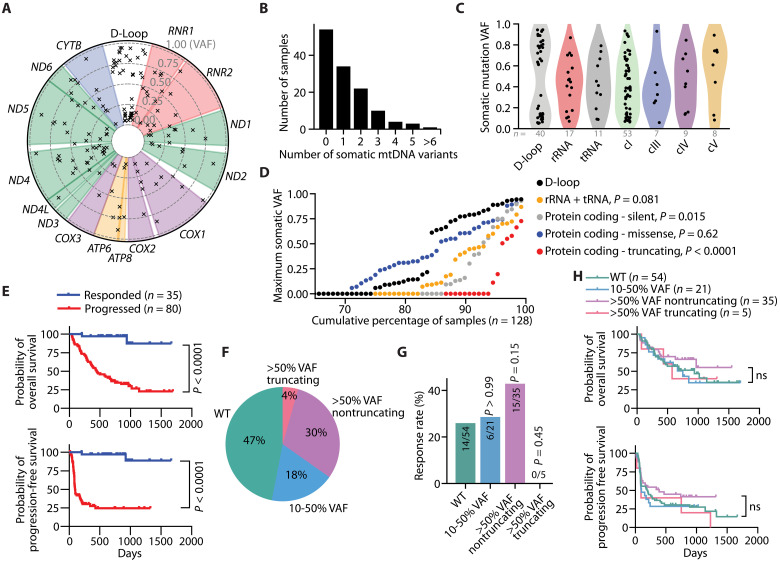
Fig. 1. Somatic mtDNA variants commonly arise in late-stage melanomas.
(A) Circos plot presenting all somatic mtDNA mutations identified within the melanoma cohort (n = 128 samples). The radial depth of the circos plot, extending from the center to the outer edge, reflects the variant allelic frequency (VAF) of each somatic mutation. (B) The number of somatic mutations identified within each melanoma sample. (C) Variant allele frequencies of somatic mtDNA mutations across different coding regions of mtDNA. (D) The cumulative distribution of the maximum mtDNA variant allele frequency categorized by mutation type. P values reflect comparisons with D-loop. (E) Kaplan-Meier plots showing overall survival (top) and progression-free survival (bottom) in melanomas with sufficient mtDNA read depth coverage. (F) The percentage of samples with annotated clinical outcomes (n = 115 total) for each mtDNA status. The WT group had no detectable somatic mtDNA mutations >0.1 VAF, while the missense and nonsense groups had the described somatic mtDNA mutations >0.5 VAF. (G) The percentage of samples responding to anti-PD1 therapies for each mtDNA status group. (H) Kaplan-Meier plot for overall survival among nonresponders to anti-PD1 therapy across samples with different mtDNA statuses. The number of samples (biological replicates) analyzed per group is indicated. Statistical significance was assessed using Mann-Whitney U test (D), Mantel-Cox (log-rank) [(E) and (H)] or χ2 test (G).

