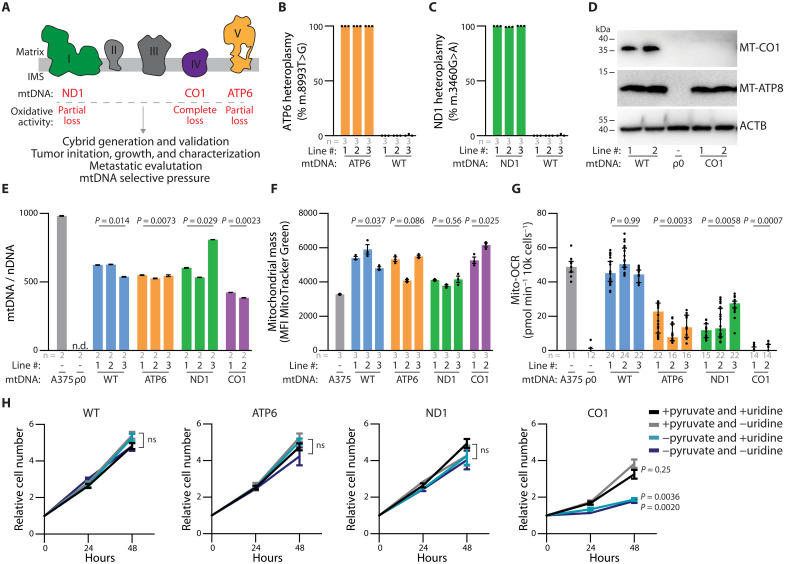
Fig. 3. mtDNA pathogenic variants in A375 homoplasmic cybrid lines affect mitochondria ETC activity.
(A) Schematic of electron transport chain with complexes labeled to display subunits with mtDNA variants investigated in this study. (B and C) ddPCR quantitation of allelic fraction for (B) MT-ATP6 mutation m.8993 T>G and (C) MT-ND1 mutation m.3460G>A in homoplasmic cybrid lines. (D) Western blot analysis for the indicated mtDNA-encoded proteins in homoplasmic cybrid cell lines. ACTB levels are shown as loading control. (E) Mitochondrial genome (mtDNA)–to–nuclear genome (nDNA) ratios in the indicated homoplasmic cybrid lines. n.d., not detected. P values reflect comparisons with the A375 parental line. (F) Mitochondrial mass as assessed by flow cytometric analysis of MTGreen staining in the indicated homoplasmic cybrid lines. P values reflect comparisons with the A375 parental line. MFI, mean fluorescence intensity. (G) Mitochondrial oxygen consumption rates (Mito-OCR) in indicated homoplasmic cybrid lines. P values reflect comparisons with the A375 parental line. (H) A375 cybrid in vitro growth rates in culture conditions deplete of pyruvate and/or uridine. P values reflect comparisons with complete media condition (+pyruvate and +uridine) at the 48-hour time point. ns, not significant. The number of samples (biological replicates) analyzed per group is indicated. Data are mean [(B) and (C)], mean ± SEM [(E), (F), and (H)], and median ± interquartile range (G). Statistical significance was assessed using one-way ANOVA with Dunn’s multiple comparison adjustment (D), nested one-way ANOVA with Dunn’s multiple comparison adjustment [(F) and (G)], and two-way ANOVA with Dunn’s multiple comparison adjustment (H).

