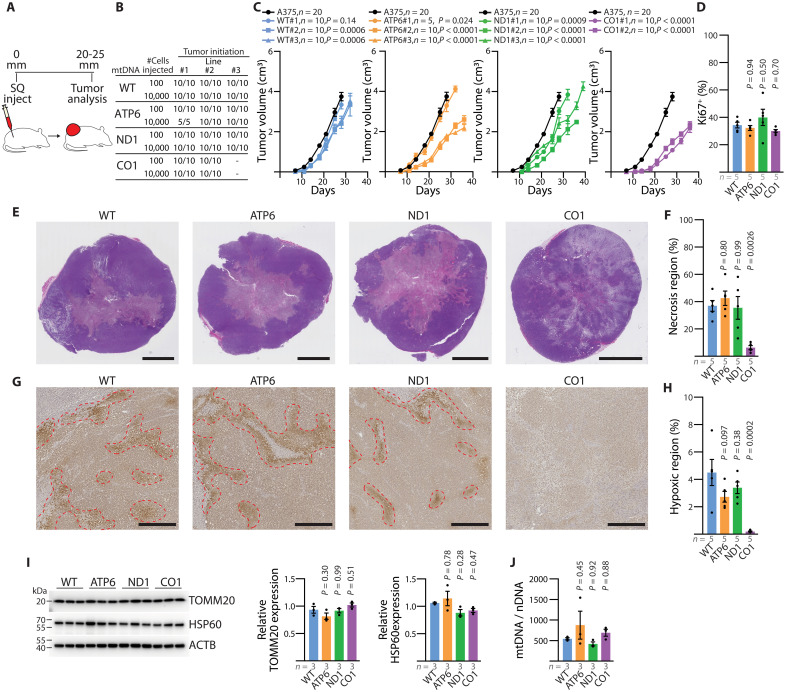
Fig. 4. Functional mtDNA is dispensable for primary melanoma growth.
(A) Illustration of subcutaneous injection to assess primary tumors of homoplasmic cybrid lines. (B) Frequency of tumor formation for indicated injection counts across homoplasmic cybrid lines. (C) Tumor growth rate of indicated cybrid lines following 10,000 cell subcutaneous injection. Homoplasmic growth data (black circle) are repeated as a reference in all panels. P values reflect comparison with the wild-type (WT) group. (D) Quantitation of the percentage of Ki67+ nuclei across subcutaneous tumors. P values reflect comparison with the WT group. (E) Representative H&E images of subcutaneous tumors. Scale bars, 5000 μm. (F) Quantitation of necrotic region as a percentage of tumor cross-sectional area. P values reflect comparison with the WT group. (G) Representative immunohistochemistry images for pimonidazole staining from subcutaneous tumors of the indicated mtDNA haplotype. Scale bars, 500 μm. (H) Quantitation of pimonidazole positive (hypoxic) regions as a percentage of tumor cross-sectional area. P values reflect comparison with the WT group. (I) Western blot analysis of mitochondrial outer membrane protein TOMM20 and matrix protein HSP60. ACTB expression is shown as loading control. P values reflect comparison with the WT group. (J) Mitochondrial genome content (mtDNA/nDNA) for subcutaneous tumors of the indicated mtDNA haplotype. The number of samples (biological replicates) analyzed per group is indicated. Data are mean ± SEM [(C), (D), (F), (H), (I), and (J)]. Statistical significance was assessed using exponential growth least squares fitting on the mean values of replicates followed by extra sum-of-squares F test with Holm-Sidak’s adjustment (C) and one-way ANOVA with Dunn’s multiple comparison adjustment [(D), (F), (H), (I), and (J)].

