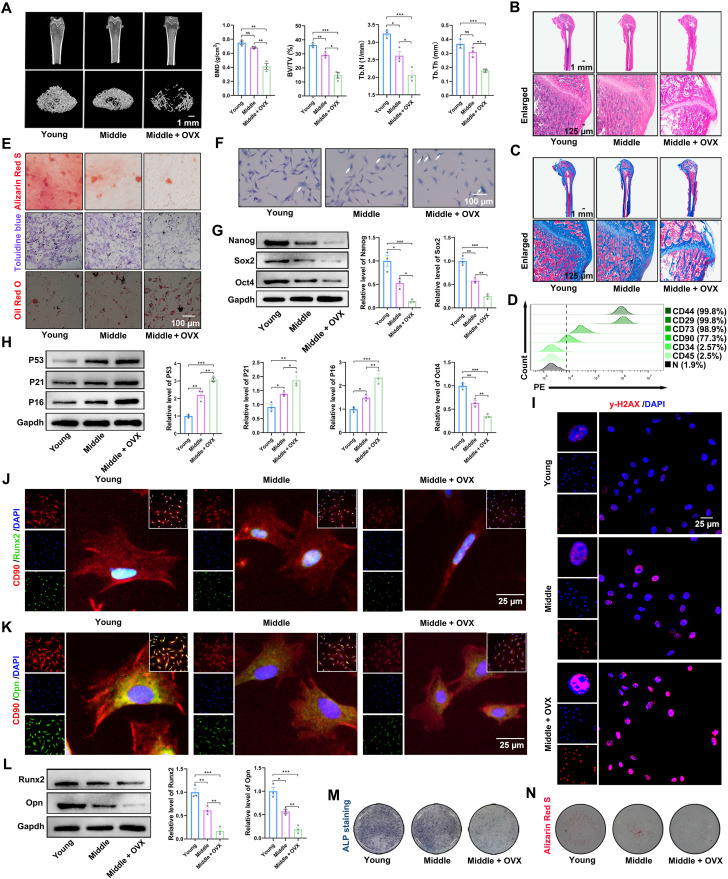
Fig. 2. BMSCs from osteoporotic rats show properties associated with aging.
(A) Micro-CT scan and 3D reconstruction results (scale bar, 1 mm); quantitative analysis of bone density, volume, and other parameters. BV/TV, bone tissue volume/total tissue; Tb.Th, trabecular thickness; Tb.N, trabecular number. (B) H&E staining images of different groups (scale bar, 1 mm and 125 μm). (C) Masson staining images of different groups (scale bar, 1 mm and 125 μm). (D) Flow cytometry showed BMSCs from osteoporotic rats were positive for CD44 (99.8%), CD29 (99.8%), CD73 (98.9%), and CD90 (77.3%) and negative for CD34 (2.57%) and CD45 (2.5%). (E) Alizarin Red S, Toluidine blue, and Oil Red O staining were used to detect osteogenic, chondrogenic, and adipogenic differentiation, respectively (scale bar, 100 μm). (F) SA-β-gal staining detected senescent cells (scale bar, 100 μm). (G) Western blotting analysis of Nanog, Sox2, and Oct4 protein expression in BMSCs from different groups. (H) Western blotting analysis of P53, P21, and P16 protein expression in BMSCs from different groups. (I) Representative immunofluorescence staining of γ-H2AX foci formation in BMSCs from different groups (scale bar, 25 μm). DAPI, 4′,6-diamidino-2-phenylindole. (J) Representative immunofluorescence staining of CD90 and Runx2 in BMSCs from the different groups (scale bar, 25 μm). (K) Representative immunofluorescence staining of CD90 and Opn in BMSCs from different groups (scale bar, 25 μm). (L) Western blotting analysis of Runx2 and Opn protein expression in BMSCs from different groups. (M) ALP staining of BMSCs from the different groups. (N) Alizarin Red S staining of BMSCs from different groups. n = 3 for each group. Error bars denote means ± SEM; ns, no significance; *P < 0.05, **P < 0.01, and ***P < 0.001.

