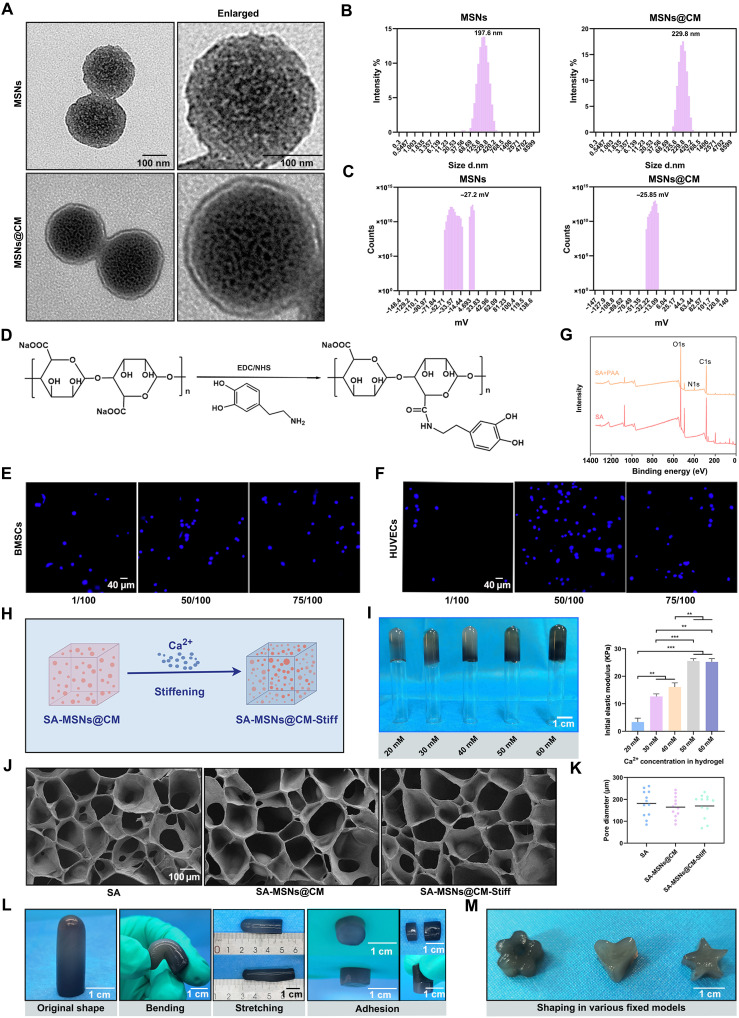
Fig. 3. Characteristics of Synthesized MSNs, SA, SA-MSNs@CM, and SA-MSNs@CM-Stiff.
(A) TEM images of MSNs and MSNs@CM (scale bar, 100 nm). (B) Size distribution of MSNs and MSNs@CM. (C) Zeta potential distribution of MSNs and MSNs@CM. (D) Schematic diagram of dopamine grafting in SA. (E) Nuclei distribution of BMSCs on the hydrogel surface (scale bar, 40 μm). (F) Nuclei distribution of HUVECs on the hydrogel surface (scale bar, 40 μm). (G) XPS measurement spectra of SA and dopamine-SA. (H) Schematic diagram of changing hydrogel stiffness by changing the Ca2+ molar concentration. (I) Images and initial elastic modulus of hydrogels in different Ca2+ molar concentration groups (scale bar, 1 cm). (J) Scanning electron microscope images of different SA hydrogels (scale bar, 100 μm). (K) Pore diameter from scanning electron microscope image. (L) Images of SA-MSNs@CM-Stiff under different external mechanical forces such as bending and stretching (scale bar, 1 cm). (M) Images of shapes prepared using SA-MSNs@CM-Stiff (scale bar, 1 cm). n = 3 for each group. Error bars denote means ± SEM; *P < 0.05, **P < 0.01, and ***P < 0.001.

