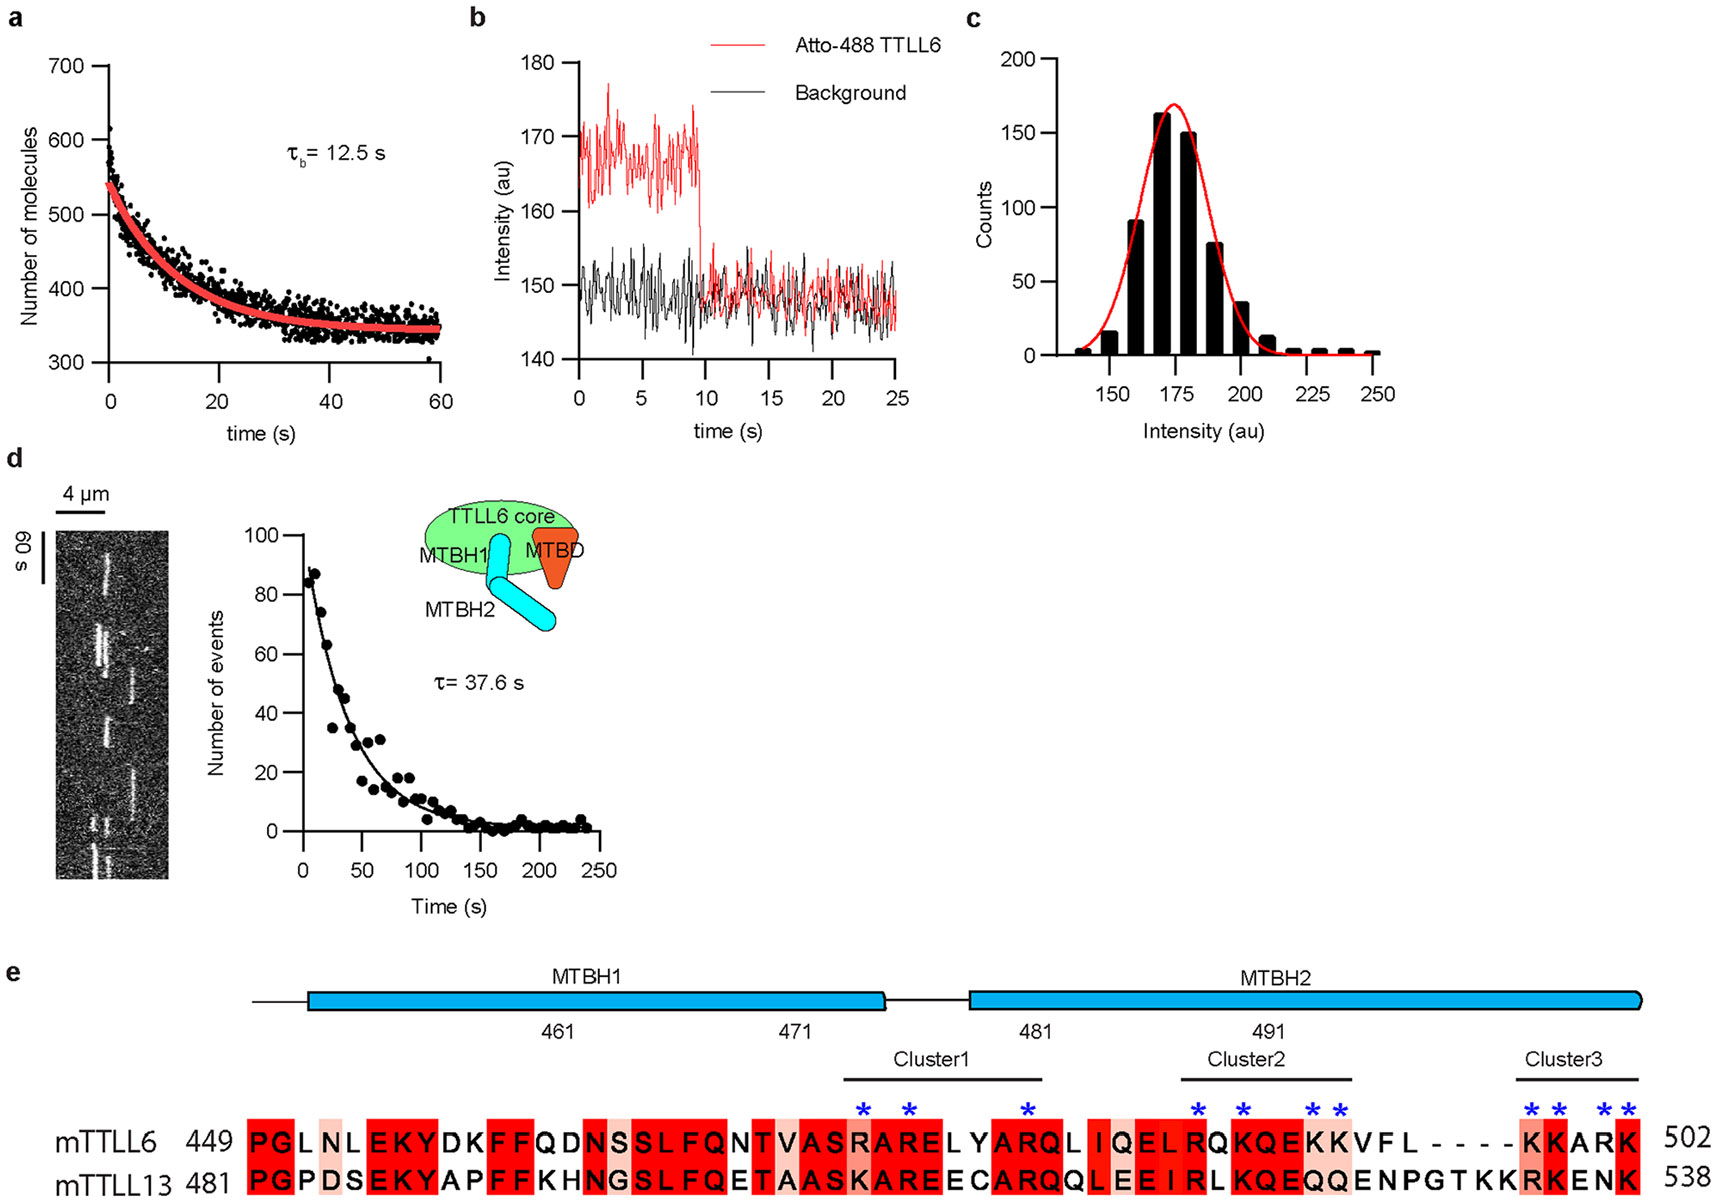
Extended Data Fig. 10 ∣. Single molecule characterization of Atto488-TTLL6 interaction with the microtubule.

a. Distribution of surface-bound single Atto488 TTLL6 over time. The number of surface-bound molecules decays exponentially as the fluorescence is bleached. An exponential decay fit (red line) yields a bleaching time of 12.5 s. b. One-step photobleaching trace of immobilized Atto488-TTLL6 consistent with the molecule existing as a monomer over the exposure time (50 ms). c. Initial fluorescence intensity distribution of Atto488-TTLL6 molecules immobilized on glass showing a monodisperse profile. d. Representative kymograph of single Atto488-TTLL6 on taxol-stabilized brain microtubules (left). Distribution of residence times of Atto488-TTLL6 with taxol-stabilized brain microtubules. The mean residence time (τ) was obtained by fitting an exponential curve to the histogram and correcting for photobleaching (R2 = 0.95, n = 791 binding events from 6 independent experiments). e. Sequence alignment of the MTBH1-2 from Mus musculus TTLL6 and TTLL13. Positively charged basic residues in the three clusters are marked with blue asterisks on top.
