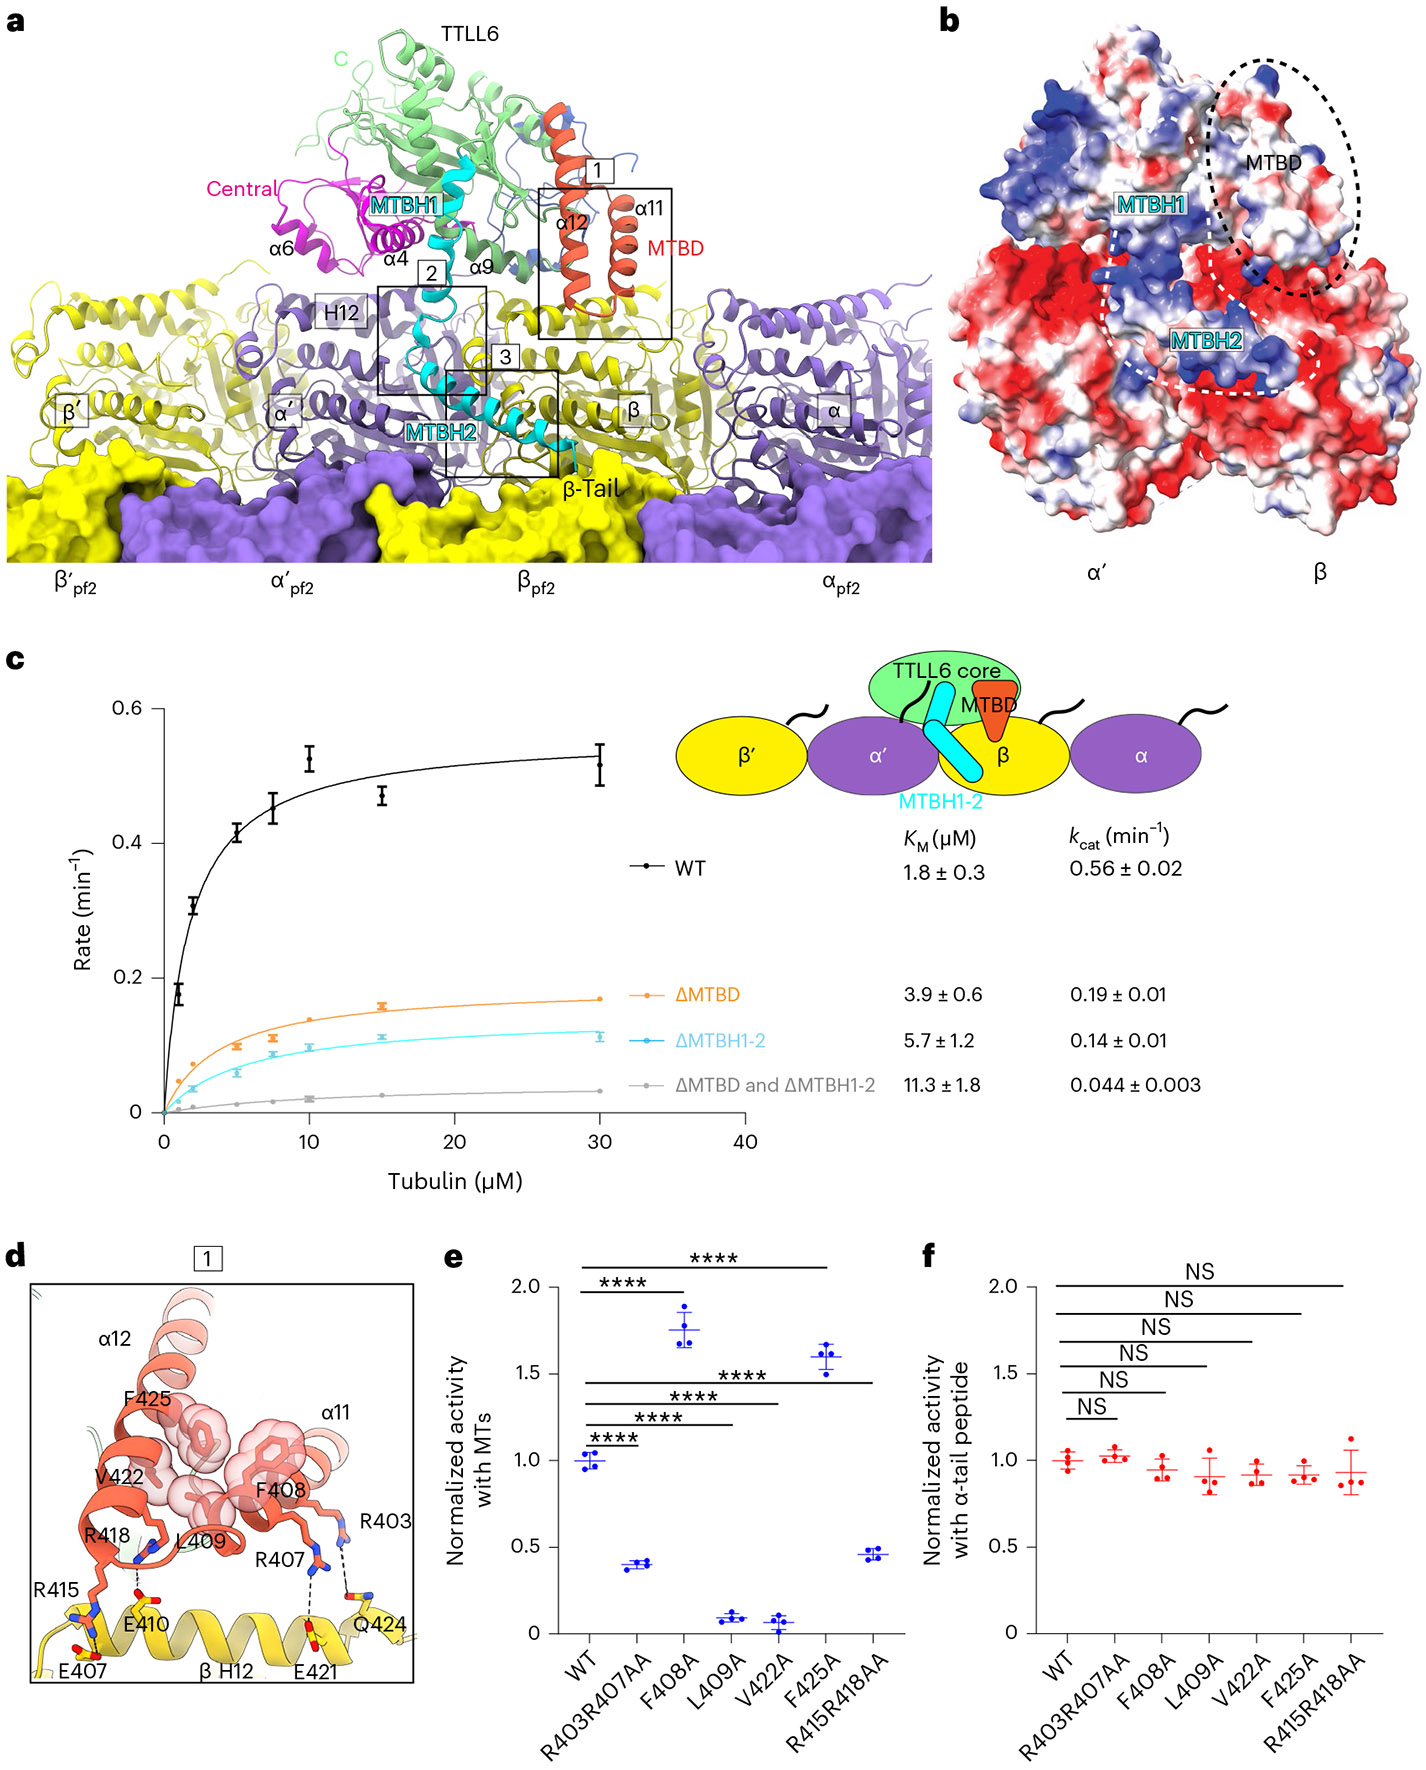
Fig. 2 ∣. TTLL6 bridges along and across PFs to modify α-tubulin tails in trans.

a, Ribbon representation of TTLL6 making interdimer and interprotofilament interactions within the MT. TTLL6 N-, central-, C-, MTBD- and MTBH1-2 domains are blue, magenta, green, orange and cyan, respectively. The tubulin subunits of the adjacent PF are shown in surface rendering. Boxed areas highlight interactions made by MTBD (box 1) and MTBH1-2 (boxes 2 and 3) with the MT. b, Surface representation of TTLL6 in the same orientation as a color-coded for electrostatic potential (red, negative; blue, positive; ranging from −10 KBT to 10 KBT). KB, Boltzmann constant; T, temperature. Electrostatic potential was calculated using Poisson Boltzmann Solver77. MTBD and MTBH1-2 are outlined with black discontinuous lines. c, Michaelis–Menten kinetics of TTLL6, TTLL6ΔMTBD, TTLL6ΔMTBH1-2 and TTLL6ΔMTBDΔMTBH1-2 with taxol-stabilized MTs. Apparent KM and kcat are listed on the right. Error bars represent s.e.m. (n = 4 independent experiments). d, Boxed area 1 in a magnified to show interactions between MTBD helices α11 and α12 and helix H12 of β-tubulin, and hydrophobic interactions between α11 and α12 in the MTBD. e,f, Normalized glutamylation activity of structure-guided TTLL6 mutants with taxol-stabilized MTs (e) and an α1B(-Y) peptide (f). Error bars, s.e.m. n = 4 independent experiments; ****P < 0.0001 and NS as determined by one-way ANOVA with Tukey’s post hoc test. ANOVA, analysis of variance; NS, not significant.
