
Fig. 4 ∣. MTBH1-2 interacts with the β-tail of the laterally adjacent tubulin dimer and discriminates between the interdimer and intradimer interface.
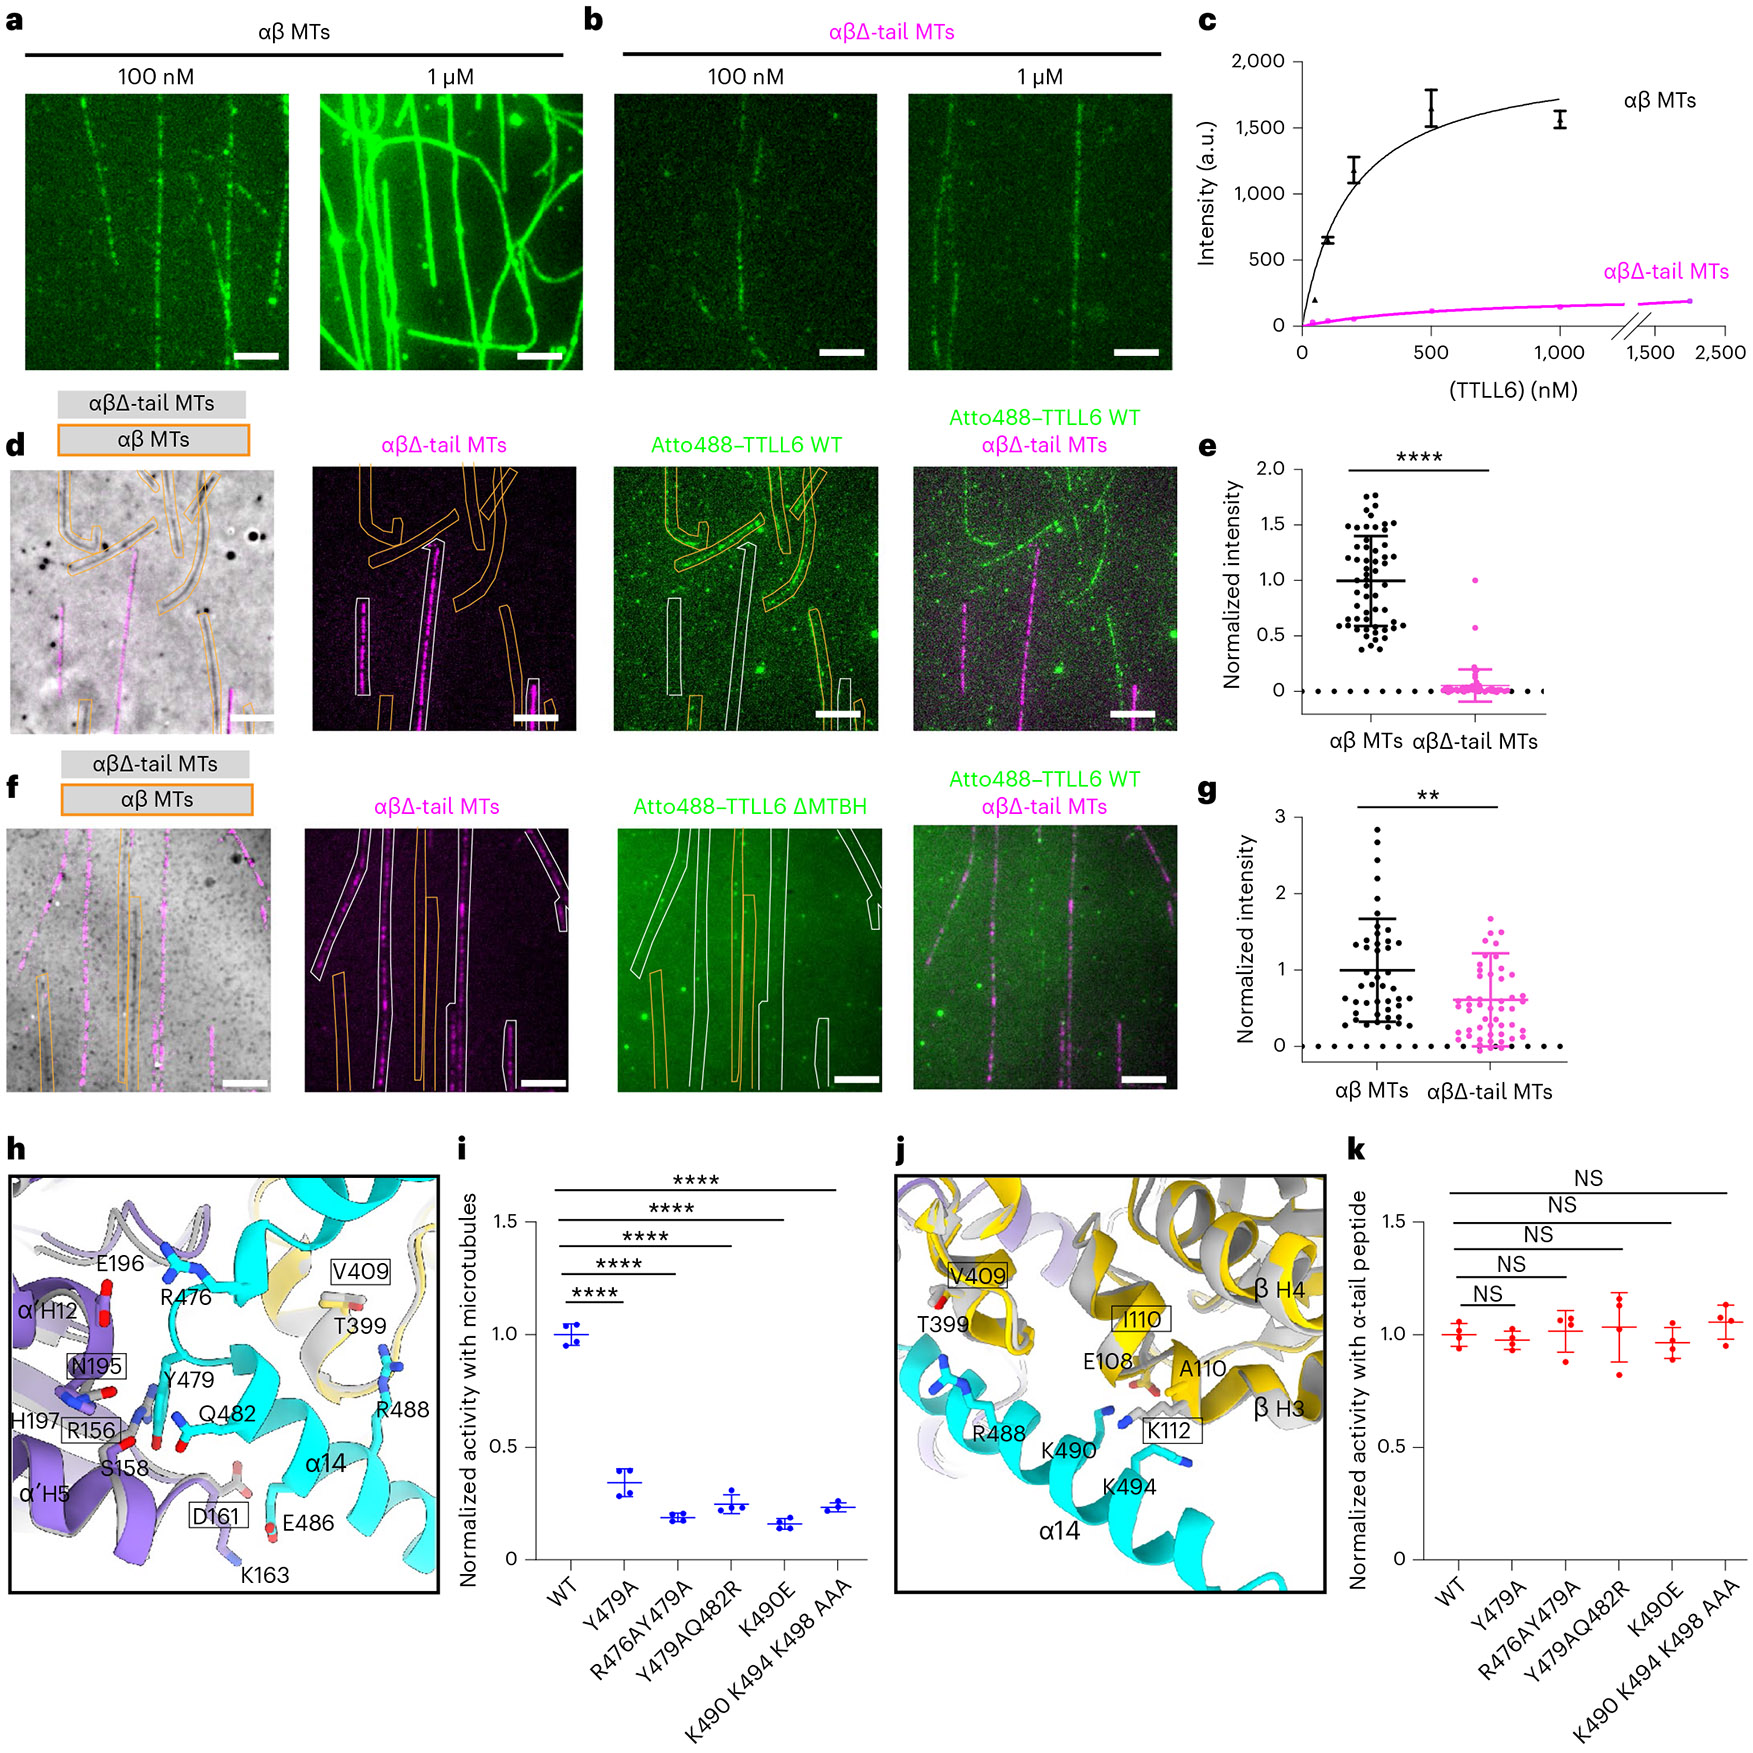
a,b, Representative images from one of three independent experiments showing Atto488–TTLL6 association with intact WT (a) and subtilisin-treated MTs missing their β-tubulin tails, αβΔ-tails (b). Scale bar, 5 μm. c, Titration curves for TTLL6 binding to WT (black) and αβΔ-tail (magenta) MTs. n = 113, 25, 46, 57 and 100 intact WT MTs for 50 nM, 100 nM, 200 nM, 500 nM and 1,000 nM TTLL6, respectively, from three independent experiments. n = 96, 37, 55, 77, 65 and 84 αβΔ-tail MTs for 50 nM, 100 nM, 200 nM, 500 nM, 1,000 nM and 2,000 nM TTLL6, respectively, from three independent experiments. Apparent Kd for WT MTs is ~210 ± 38 nM. Error bars, s.e.m. d, Representative images from 64 and 47 MTs analyzed for WT and αβΔ-tail, respectively, from two independent experiments showing Atto488–TTLL6 recruitment to WT and αβΔ-tail MTs. Scale bar, 5 μm. WT and αβΔ-tail-647-Hilyte MTs are outlined in orange and white, respectively. e, Normalized measurements of Atto488–TTLL6 recruitment to WT and αβΔ-tail MTs. n = 64 and 47 MTs for WT and αβΔ-tail, respectively, from two independent experiments. Data are presented as mean ± s.d. ****P < 0.0001 by two-tailed Mann–Whitney test. f, Representative images from 51 and 44 MTs analyzed for WT and αβΔ-tail, respectively, from two independent experiments showing Atto488–TTLL6ΔMTBH1-2 recruitment to WT and αβΔ-tail MTs. Scale bar, 5 μm. WT unlabeled and αβΔ-tail-647-Hilyte labeled MTs are outlined in orange and white, respectively. g, Normalized measurements of Atto488–TTLL6ΔMTBH1-2 recruitment to WT and αβΔ-tail MTs; n = 51 and 44 MTs for WT and αβΔ-tail, respectively, from two independent experiments. Data are presented as mean ± s.d. **P < 0.01 by two-tailed Mann–Whitney test. h, Ribbon representation highlighting key interactions made by the N-terminus of MTBH2 (cyan) with α’-tubulin and β-tubulin (purple and yellow, respectively) at the interdimer interface of the complex structure. Residues important for interactions with the MTBH1-2 are shown in stick representation in purple and yellow. Modeled are superpositions of β-tubulin (gray) on α′-tubulin of the structure, and α-tubulin (gray) on β-tubulin of the structure. Residues in the modeled intradimer interface are in gray stick representation, and their identities are in boxes. i, Normalized glutamylation activity of structure-guided TTLL6 mutants in the MTBH1-2 with taxol-stabilized MTs. Error bars, s.e.m.; n = 4 independent experiments; ****P < 0.0001 and NS as determined by one-way ANOVA with Tukey’s post hoc test. j, Ribbon representation highlighting key interactions made by the C-terminus of MTBH2 (cyan) with the β-tubulin (yellow) at the interdimer interface. Colors and labels as in h. k, Normalized glutamylation activity of structure-guided TTLL6 mutants in the MTBH1-2 with α1B(-Y) peptide. Error bars, s.e.m.; n = 4 independent experiments; NS as determined by one-way ANOVA with Tukey’s post hoc test.