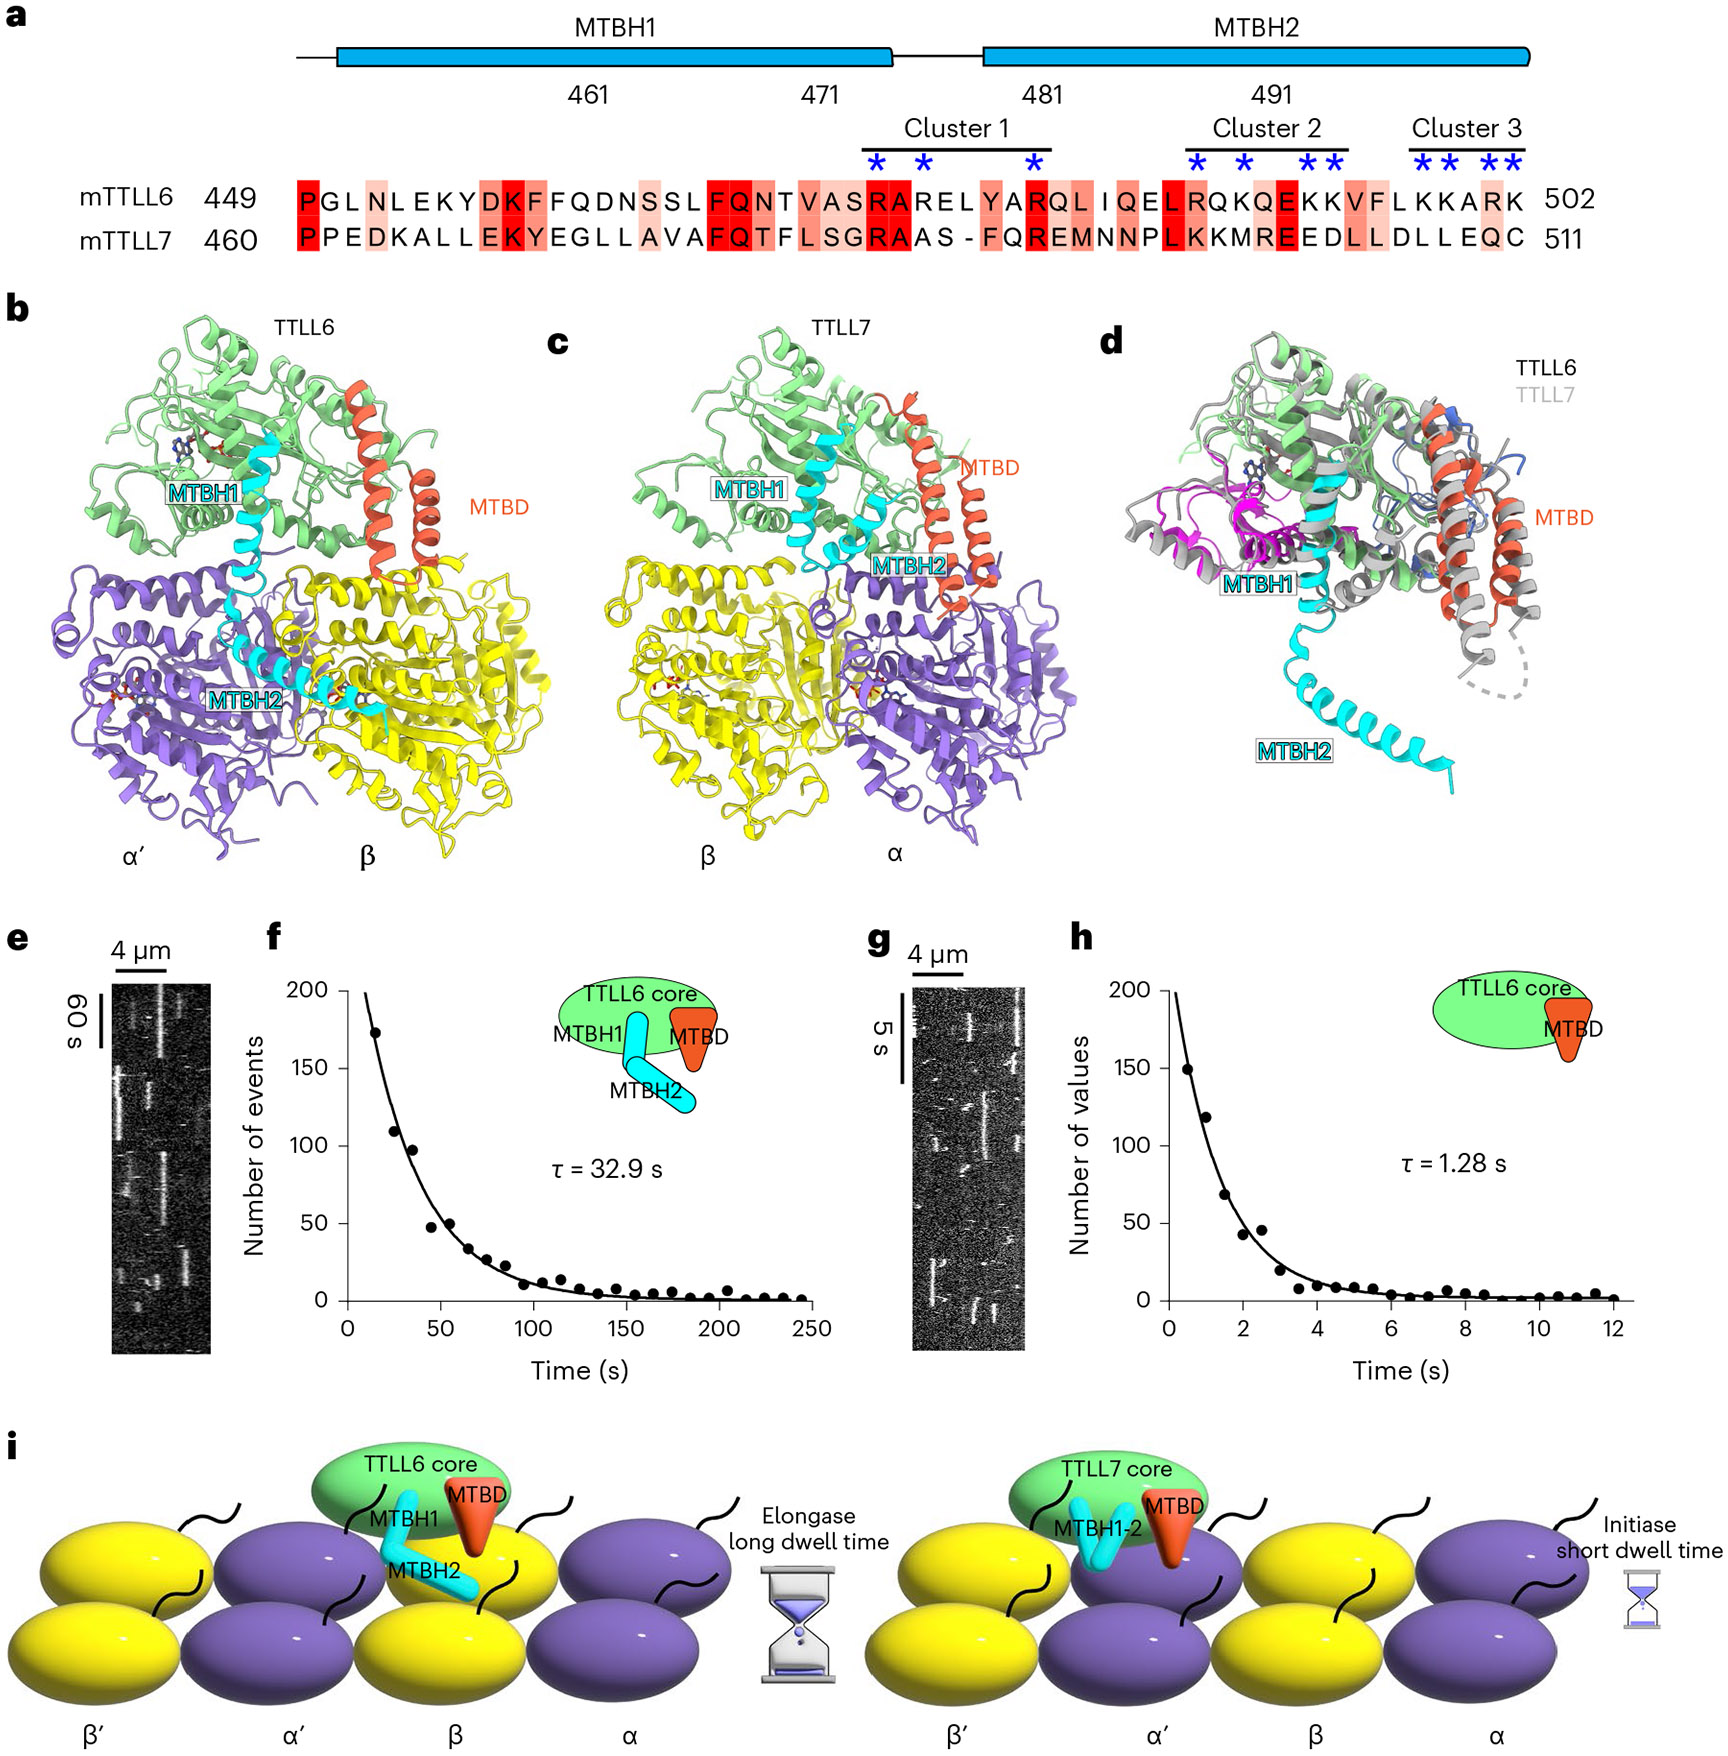
Fig. 5 ∣. MTBH1-2 is an elongase-specific module that controls TTLL6 residence time on the MT.

a, Sequence alignment of mouse TTLL6 and TTLL7 MTBH1-2. Residues are colored according to conservation; residues in the cationic clusters important for interaction with the MT are highlighted by blue asterisks. b,c, Ribbon representation of TTLL6 (b) and TTLL7 (c) bound at the interdimer and intradimer interface, respectively. The N-, central-, C-, MTBD- and MTBH1-2 domains are shown in blue, magenta, green, orange and cyan, respectively. α-Tubulin and β-tubulin subunits are shown in purple and yellow, respectively. d, Ribbon representation of superimposed TTLL6 (colored as in b) and TTLL7 (gray) showing the extended conformation of the MTBH1-2 in TTLL6. e, Representative kymograph from one of six independent experiments showing single Atto488–TTLL6 molecules on GMPCPP-stabilized brain MTs (Methods). f, Distribution of MT residence times of Atto488–TTLL6; the mean residence time (τ) was obtained by fitting an exponential curve to the histogram and correcting for photobleaching (R2 = 0.98, n = 951 binding events from six independent experiments). g, Representative kymograph from one of seven independent experiments showing single Atto488–TTLL6ΔMTBH1-2 molecules on GMPCPP-stabilized brain MTs. h, Distribution of MT residence times of Atto488–TTLL6 MTBH1-2. The mean residence time (τ) was obtained by fitting an exponential curve to the histogram and correcting for photobleaching (R2 = 0.95, n = 574 binding events from seven independent experiments). i, Schematic representation showing the interdimer and intradimer interface recognition by TTLL6 and TTLL7, respectively. The extended conformation of the TTLL6 MTBH1-2 domain increases MT residence time for efficient glutamate chain elongation.
