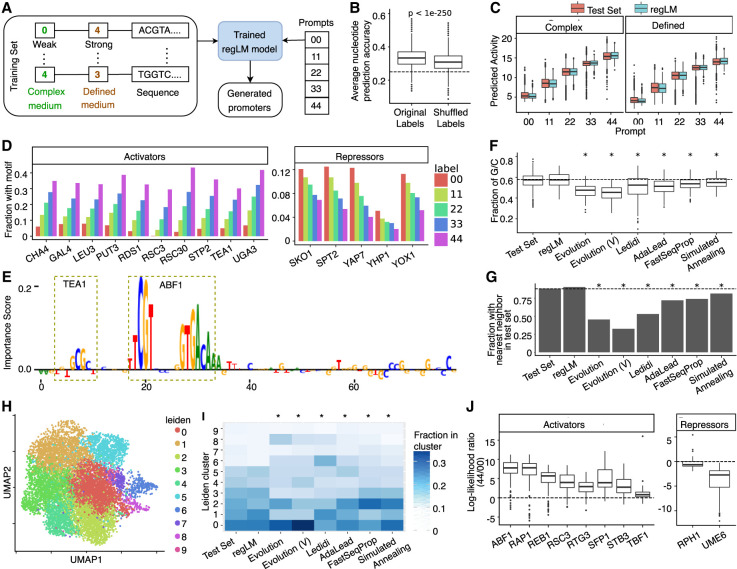
Figure 2.
regLM generates synthetic yeast promoters. (A) Schematic of the experiment. (B) Box plot showing the mean accuracy of the trained regLM model on test set sequences, before and after randomly shuffling the labels among sequences. The dashed line represents the accuracy of 0.25 expected by chance. (C) Predicted activity of regLM-generated promoters, compared to promoters from the test set with the same label. (D) Fraction of regLM promoters prompted with different labels that contain the TF motifs most strongly correlated with promoter activity in the test set. (E) Example of a regLM-generated strong promoter. Height represents the per-nucleotide importance score obtained from the paired regression model using in silico mutagenesis. Motifs with high importance are highlighted. (F) Fraction of G/C bases in strong promoters generated by different methods. (G) Fraction of generated promoters whose nearest neighbor based on k-mer content is a validated promoter from the test set, for different methods. (H) UMAP visualization of true (Test Set) and synthetic strong promoters, labeled by cluster membership. (I) Cluster distribution of strong promoters generated by different methods. (J) Box plots showing the log-ratio between the likelihood of the motif sequence given label 44 (high activity) versus label 00 (low activity) for activating or repressing TF motifs inserted in random sequences. Motifs were selected based on TF-MoDISco results. In F, G, and I, asterisks indicate significant (P < 0.05) differences from the test set, and Evolution (V) represents synthetic promoters generated by Vaishnav et al. (2022).

