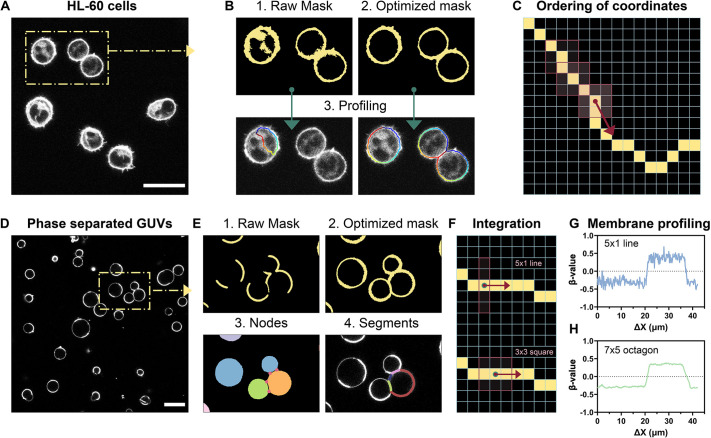
Fig. 3.
Profiling of membranes. (A) Raw image of human leukaemia suspension cell lines (HL-60) stained with an environment-sensitive probe (Pro12A) used for measurement of membrane fluidity. (B) The effect of mask optimization on the profiling of the plasma membrane. The raw mask is obtained by applying an automatic threshold via the Otsu algorithm, whereas the optimized mask is derived by choosing a channel with low cytosolic background for thresholding and applying the function for pixel compression, to obtain a continuous membrane. (C) Schematic for the ordering of the pixel coordinates from the 1-pixel wide line used for the membrane profiling. The line (in yellow) is centred onto the plasma membrane, and a 3×3 pixel square box is slid along the line. (D) Raw image of phase-separated GUVs stained with an environment-sensitive probe (NR12S) used for measurement of membrane fluidity. (E) The effect of mask optimization for membrane profiling and segment detection in clustered vesicles. The raw mask is obtained by applying an automatic threshold via the Otsu algorithm. Then, the optimized mask is derived by performing the following steps: (1) select a channel for thresholding in which the two phases have similar brightness; (2) applying compress pixel values according to the dedicated function and (3) performing dilation of the binary mask to obtain a continuous membrane. On the optimized mask, the software detects nodes in clustered vesicles and, if the profiling mode is activated, it profiles individual segments (4). (F) Schematic for the signal integration during membrane profiling (line versus square). (G,H) The effect of choosing a different integrating element on profiled curves for β-value (i.e. parameter under investigation). The larger the area of the integrating element the smother the profiled curve. Scale bars: 25 µm. ΔX represents the lateral displacement along the membrane of the vesicle in µm.

