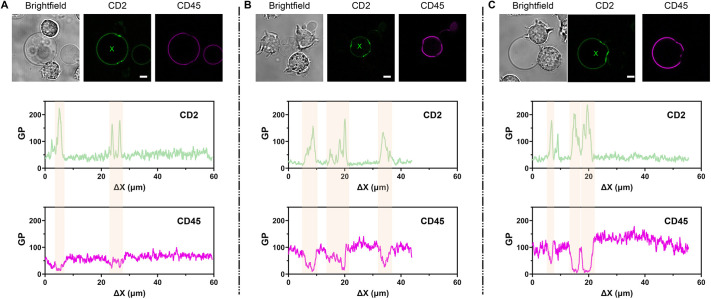
Fig. 6.
VISION reveals protein cluster formations at the cell-to-GUV contact site. (A–C) Examples of Jurkat T cells interacting with GUVs decorated with CD2 and CD45 adhesion proteins. The green and magenta channels refer to CD2 and CD45 protein, respectively. The pink areas in the profiled trajectories highlight either accumulation or exclusion of proteins from the membrane-membrane contact area. We analysed contact areas from three different biological replicates (>45 GUVs). Scale bar: 5 µm. In the profiled trajectories, ΔX represents the lateral displacement along the vesicle membrane in µm.

