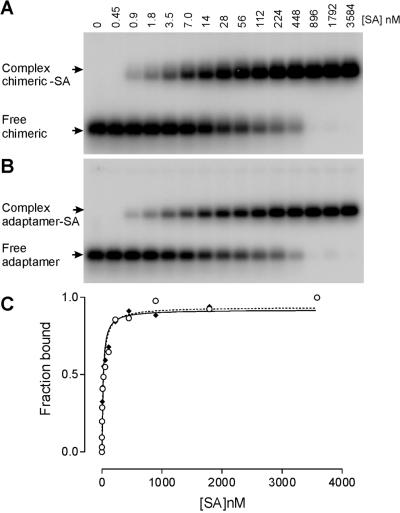
Figure 7.
Native gel mobility shift assay of SA binding to chimeric SA19 and adaptamer. (A) Storage phosphor autoradiogram of a representative gel used to separate free chimeric aptamer SA19–CopA from SA19–CopA/SA complex, using a range of increasing protein concentrations from 0.45 to 3584 nM. (B) The same analysis as described in (A) but with the adaptamer SA19–CopA–E14–CopT. (C) Representative plots of fraction of the chimeric SA19–CopA (continuous line) and the adaptamer SA19–CopA–E14–CopT (dotted line) bound by SA as a function of protein concentration. The data were fitted to a hyperbolic function by non-linear curve fitting method of GraphPad PRISM. These titrations yielded an equilibrium dissociation constant of ∼18 and 24 nM for the chimeric SA19–CopA and the adaptamer SA19–CopA–E14–CopT, respectively.

