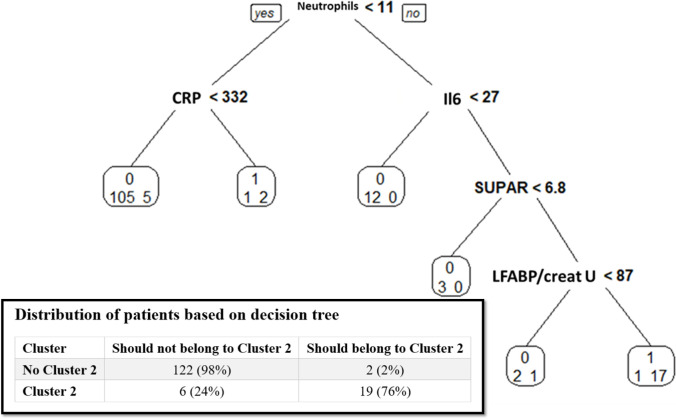
Fig 3. Prediction to belong to Cluster 2 using classification and regression tree analysis.
Tree is built such as 0: should not belong to cluster 2, 1: should belong to cluster 2; and below: left number actual patients in the studied population who did not belong to cluster 2; right number: actual patients in the studied population who belonged to Cluster 2. CRP: C-reactive protein (in mg/L), creat U: urinary creatinine (in mmol/L), Il, interleukin (in pg/L,; LFABP, liver fatty acid binding protein (in ng/mL,; SUPAR, soluble urokinase plasminogen activator receptor (in ng/mL) The binary tree was built in the training set using Breiman methods with Rpart package version 4.1–10, R version 3.1.0. The structure is similar to a real tree, from the bottom up: there is a root, where the first split happens. After each split, two new nodes are created. Each node contains only a subset of the patients. The partitions of the data, which are no longer split, are called terminal nodes or leafs. The second stage of the procedure consists in pruning the tree using cross-validation. Pruning means to shorten the tree, which makes trees more compact and avoids over-fitting to the training data. Each split is examined if it makes a reliable improvement. The six variables used by the binary tree are neutrophils, CRP, IL-6, SUPAR and LFABP/urinary creatinine ratio. The accuracy of the binary tree evaluated in the training dataset is given in Table 4.

