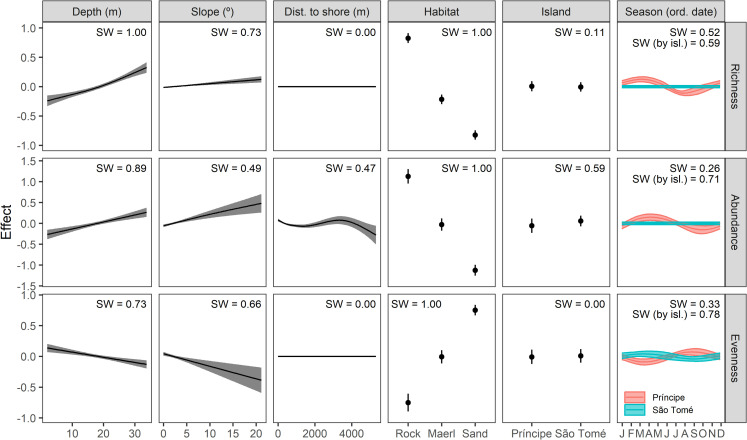
Fig 3. Partial effect of predictors on diversity indicators.
Predicted values from GAMs described in S6 Table, representing the partial effect of environmental and physical variables (depth, slope, distance to shore, habitat, island and season) on diversity indicators (species richness, S; fish relative abundance, MaxN; and E1/D evenness index). Depth, distance to shore and slope were modelled as thin plate splines, while intra annual seasonality (ordinal date) was modelled as a cyclic cubic spline; months represented in the x axis. Seasonality splines were also grouped by island to assess the effects of their interaction. Partial effects of smooth terms were calculated using the R package gratia [47], averaging across models retained in the top model set and substituting by zero when a predictor was not present in a model. The level of support of each predictor in the best performing models was calculated as the sum of weighted AICs (Summed Weights, SW); with values closer to one indicating a greater and more consistent support for the predictor of interest across the retained models. A detail of the smooth terms and residuals is available in S4 Fig.

