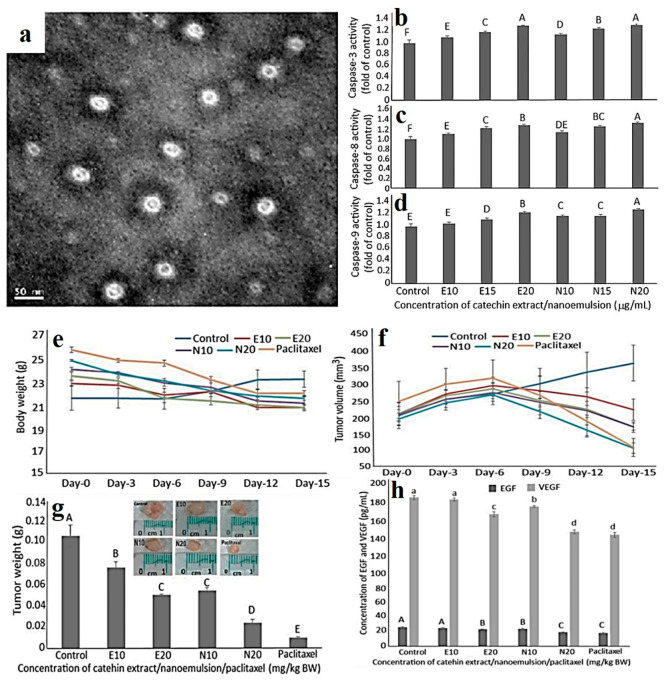
Figure 9.
(a) Size and shape by transmission electron microscope. Effects of CE and CNE on (b) caspase-3 (b), caspase-8 (c), and caspase-9 (d) activities of prostate cancer cell DU-145 [CE treatment: E10 (10 μg/mL), E15 (15 μg/mL), and E20 (20 μg/mL); CNE treatments: N10 (10 μg/mL), N15 (15 μg/mL), and N20 (20 μg/mL). Data represented as mean ± s.d. (n = 3), with data bearing different capital letters (A–F) to denote significantly different values at p < 0.05. Effects of CE, CNE, and paclitaxel (PTX) on (e) body weight, (f) tumor volume, (g) tumor weight, and (h) serum EGF and VEGF levels of nude mice. [E10 (10 mg/kg BW) and E20 (20 mg/kg BW), with the same injection volume (0.2 mL), while N10 and N20 are CNE treatments at the same dose. For PTX treatment (0.2 mL and 10 mg/kg BW) was used. Data are shown as mean ± s.d. (n = 3), and capital letters (A–E) and small letters (a–d) denote significant different values at p < 0.05. Reproduced with permission from ref (122). Copyright 2021 MDPI.

