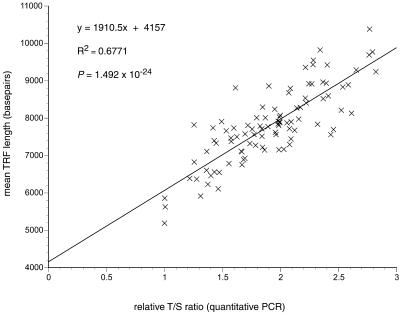
Figure 5.
Correlation of relative T/S ratios determined by quantitative PCR and mean TRF lengths determined by Southern blot analysis in DNA samples prepared directly from blood draws on 95 individuals. All relative T/S ratios plotted here have values ≥1.0, because the initial T/S ratios determined using the standard curves have all been normalized to the lowest T/S ratio (0.69) observed among the samples. The equation for the linear regression line best fitting the data is shown.

