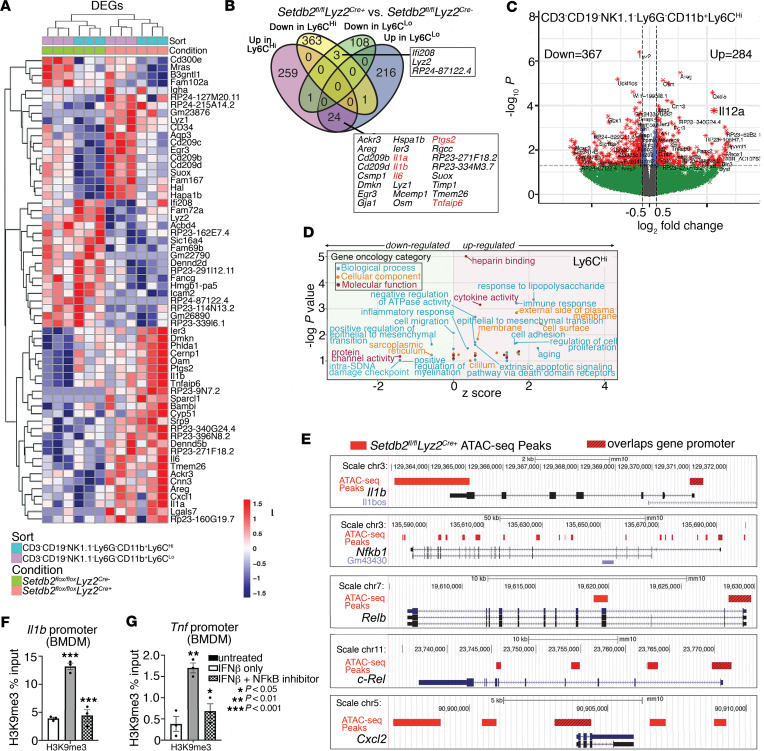
Figure 1. SETDB2 is enriched at NF-κB–dependent gene promoters in murine wound macrophages.
Wound macrophages were isolated from Setdb2fl/fl Lyz2Cre mTmG murine wounds on day 5 after wounding, sorted into CD3–CD19–NK1.1–Ly6G–CD11b+Ly6Chi and CD3–CD19–NK1.1–Ly6G–CD11b+Ly6Clo populations, and then analyzed for gene expression by RNA-Seq and ATAC-Seq. (A) Heatmap of DEGs in wound macrophages isolated from Setdb2fl/fl Lyz2Cre mTmG murine wounds on day 5 after wounding. Wound macrophages were sorted into CD3–CD19–NK1.1–Ly6G–CD11b+Ly6Chi and CD3–CD19–NK1.1–Ly6G–CD11b+Ly6Clo populations and then analyzed for gene expression by RNA-Seq (12–15 mice per group, n = 3–5 independent experiments). (B) Venn diagram comparing upregulated and downregulated genes from RNA-Seq of wound macrophages (CD3–CD19– NK1.1–Ly6G–CD11b+Ly6Chi and CD3–CD19–NK1.1–Ly6G–CD11b+Ly6Clo) isolated from Setdb2fl/fl Lyz2Cre mTmG mouse wounds on day 5 after wounding. (C) Volcano plot of transcriptomic profiles from DEGs in CD3–CD19–NK1.1–Ly6G–CD11b+Ly6Chi wound macrophages from Setdb2fl/fl Lyz2Cre mTmG mice. (D) GO analysis of DEGs in CD3–CD19–NK1.1–Ly6G–CD11b+Ly6Chi wound macrophages from Setdb2fl/fl Lyz2Cre mTmG mice. (E) Inflammatory gene promoter regions differentially regulated by SETDB2 as determined by ATAC-Seq of wound macrophages (CD3–CD19–NK1.1–Ly6G–CD11b+Ly6C+ GFP+) isolated on day 5 from Setdb2fl/fl Lyz2Cre mTmG mice. Red bars indicate ATAC-Seq peaks relative to Cre-negative controls. Hashed red bars designate peaks that overlap promoter regions of listed genes. (F and G) H3K9me3 ChIP qPCR at the Il1b and Tnf promoters in murine BMDMs unstimulated or treated with IFN-β (10 U/mL; 8.5 ng/mL) or IFN-β and NF-κB inhibitor, BAY 11-7082 (10 μM). Data are representative of n = 3–5 independent experiments, with 12–15 mice per group per experiment. *P < 0.05, **P < 0.01, ***P < 0.001. Data are presented as the mean ± SEM. Two-tailed Student’s t test was used for comparison of 2 groups. For comparison among multiple groups, 2-way ANOVA followed by Newman-Keuls post hoc test was used.

