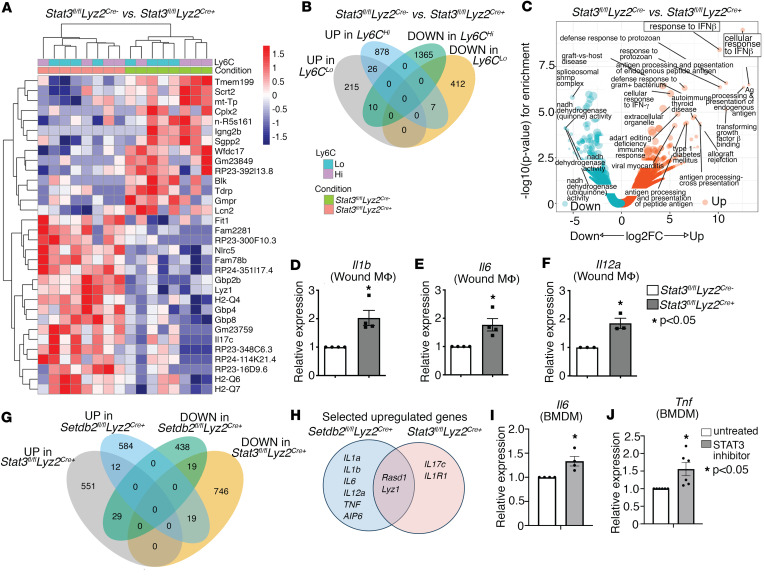
Figure 4. STAT3 and SETDB2 coregulate inflammatory gene expression in wound macrophages.
(A) Heatmap of DEGs in day 5 wound macrophages (CD3–CD19–NK1.1–Ly6G–CD11b+) from Stat3fl/fl Lyz2Cre mice and Cre– littermate controls (n = 6 mice per group). (B) Diagram comparing overlapping genes among upregulated and downregulated genes from RNA-Seq of Stat3fl/fl Lyz2Cre wound macrophages (CD3–CD19–NK1.1–Ly6G–CD11b+). (C) Volcano plot of GO analysis for the enriched biological processes in decreased and increased DEGs from Stat3fl/fl Lyz2Cre wound macrophages. (D–F) qPCR of Il1b (D), Il6 (E), and Il12a (F) in of Stat3fl/fl Lyz2Cre BMDMs treated with IFN-β (10 U/mL; 8.5 ng/mL) for 6 hours (n = 5 mice per group). (G) Diagram demonstrating overlapping genes among upregulated and downregulated DEGs from RNA-Seq of Setdb2fl/fl Lyz2Cre and Stat3fl/fl Lyz2Cre CD3–CD19–NK1.1–Ly6G–CD11b+ macrophages isolated from day 5 wounds. (H) Venn diagram of overlapping and distinct upregulated inflammatory genes in the CD3–CD19–NK1.1–Ly6G–CD11b+Ly6Chi population from wounds isolated on day 5 from Setdb2fl/fl Lyz2Cre and Stat3fl/fl Lyz2Cre mice. (I and J) mRNA expression of Il6 and Tnf in BMDMs treated with a STAT3 inhibitor compared with untreated (n = 5 mice per group in each experiment). All data are representative of n = 3–5 independent experiments. *P < 0.05. Data are presented as the mean ± SEM. Two-tailed Student’s t test was used for comparison of 2 groups. For comparison among multiple groups, 2-way ANOVA followed by Newman-Keuls post hoc test was used.

