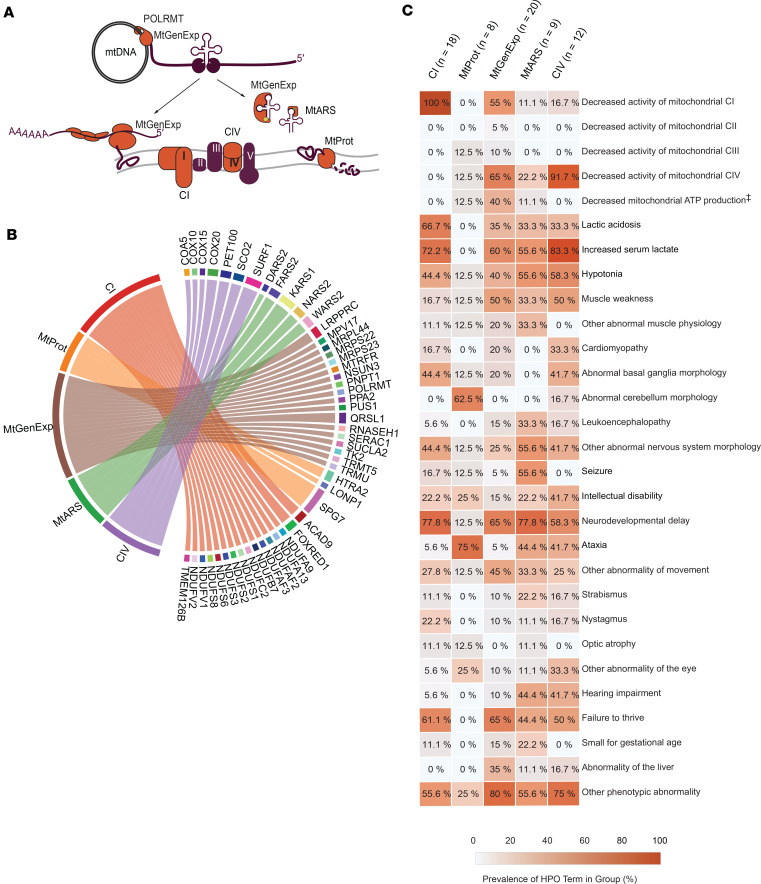
Figure 1. Cohort description and HPO terms in patient groups.
Medical chart review revealed HPO terms associated with mitochondrial disease. (A) Localization of cohort groups relative to mitochondrial biological function, OXPHOS (CI and CIV), Proteolytic function (MtProt), Aminoacylation of tRNAs (MtARS), mtDNA transcription (MtGenExp), tRNAs modification (MtGenExp) and RNA translation (MtGenExp). (B) Chord diagram illustrating cohort genes of interest and their relationship with the groups as defined in the methods and results sections. Line width thickness is equivalent to number of times gene is represented in group. Other genes with variants identified in the cohort but not shown in the plot are UROD, DPYS, SLC6A17, and DHTKD1 (C) Prevalence of HPO term in patient group in percentage (%) (further described in Supplemental Data File 1). Number of cases in each group: CI (n = 18), MtProt (n = 8), MtGenExp (n = 20), MtARS (n = 9), CIV (n = 12) ‡, “Decreased mitochondrial ATP Production” is not an official HPO term.

